Iraqi vs Immigrants from Norway Single Mother Poverty
COMPARE
Iraqi
Immigrants from Norway
Single Mother Poverty
Single Mother Poverty Comparison
Iraqis
Immigrants from Norway
28.8%
SINGLE MOTHER POVERTY
71.5/ 100
METRIC RATING
156th/ 347
METRIC RANK
29.3%
SINGLE MOTHER POVERTY
41.5/ 100
METRIC RATING
180th/ 347
METRIC RANK
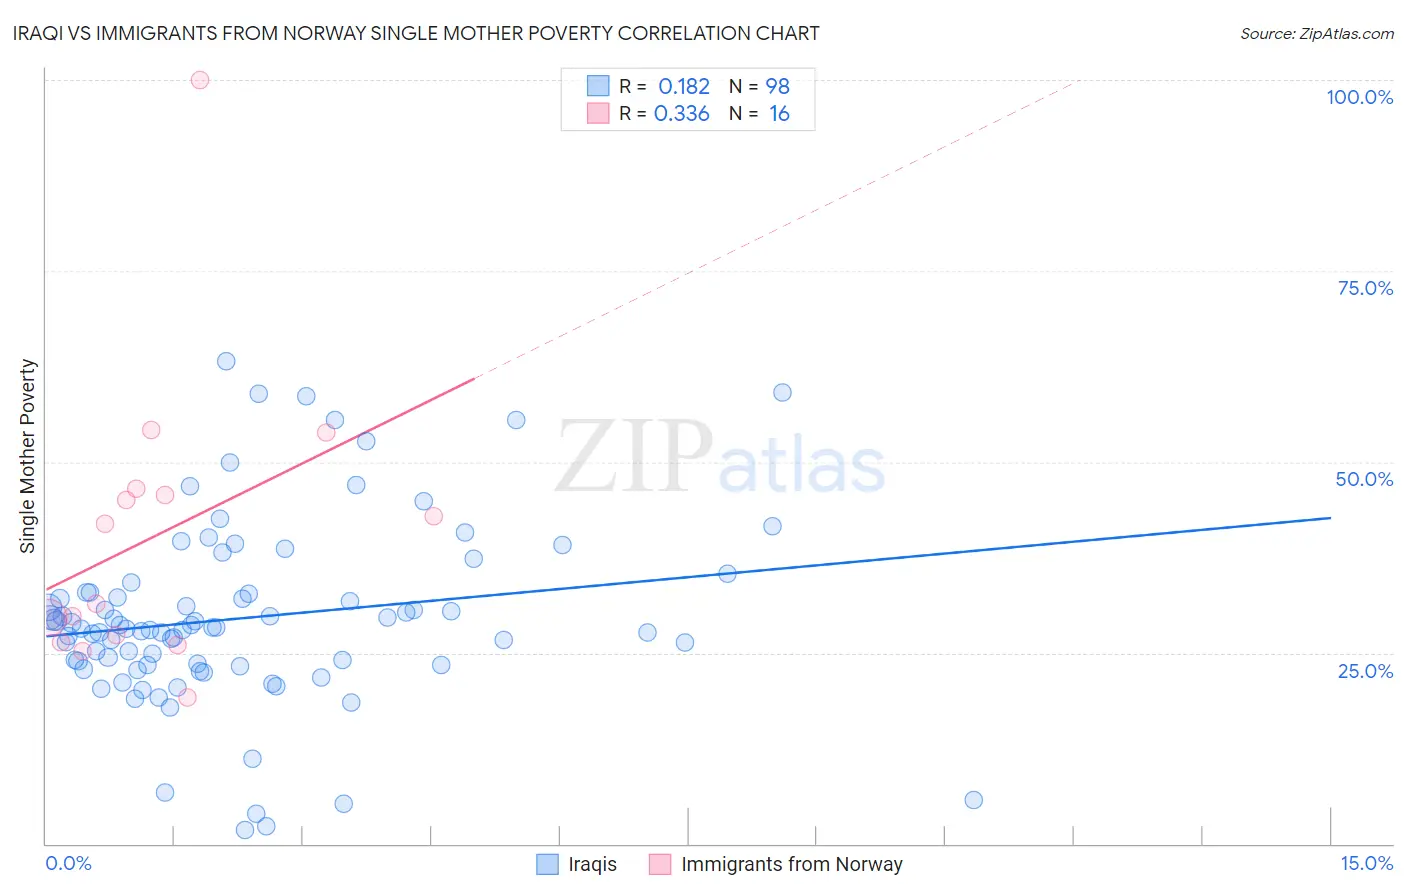
Iraqi vs Immigrants from Norway Single Mother Poverty Correlation Chart
The statistical analysis conducted on geographies consisting of 169,065,579 people shows a poor positive correlation between the proportion of Iraqis and poverty level among single mothers in the United States with a correlation coefficient (R) of 0.182 and weighted average of 28.8%. Similarly, the statistical analysis conducted on geographies consisting of 115,092,728 people shows a mild positive correlation between the proportion of Immigrants from Norway and poverty level among single mothers in the United States with a correlation coefficient (R) of 0.336 and weighted average of 29.3%, a difference of 1.5%.
Single Mother Poverty Correlation Summary
| Measurement | Iraqi | Immigrants from Norway |
| Minimum | 1.9% | 19.1% |
| Maximum | 63.2% | 100.0% |
| Range | 61.3% | 80.9% |
| Mean | 29.6% | 40.3% |
| Median | 28.2% | 36.6% |
| Interquartile 25% (IQ1) | 23.4% | 26.8% |
| Interquartile 75% (IQ3) | 32.9% | 46.1% |
| Interquartile Range (IQR) | 9.4% | 19.3% |
| Standard Deviation (Sample) | 11.9% | 19.3% |
| Standard Deviation (Population) | 11.9% | 18.7% |
Similar Demographics by Single Mother Poverty
Demographics Similar to Iraqis by Single Mother Poverty
In terms of single mother poverty, the demographic groups most similar to Iraqis are Ugandan (28.8%, a difference of 0.010%), Immigrants from Western Europe (28.9%, a difference of 0.030%), Immigrants from Hungary (28.9%, a difference of 0.060%), Portuguese (28.8%, a difference of 0.10%), and Czech (28.9%, a difference of 0.18%).
| Demographics | Rating | Rank | Single Mother Poverty |
| Serbians | 85.0 /100 | #149 | Excellent 28.6% |
| Northern Europeans | 81.7 /100 | #150 | Excellent 28.6% |
| Immigrants | Oceania | 79.9 /100 | #151 | Good 28.7% |
| Austrians | 79.0 /100 | #152 | Good 28.7% |
| Slovenes | 76.4 /100 | #153 | Good 28.8% |
| Portuguese | 73.2 /100 | #154 | Good 28.8% |
| Ugandans | 71.7 /100 | #155 | Good 28.8% |
| Iraqis | 71.5 /100 | #156 | Good 28.8% |
| Immigrants | Western Europe | 71.1 /100 | #157 | Good 28.9% |
| Immigrants | Hungary | 70.6 /100 | #158 | Good 28.9% |
| Czechs | 68.4 /100 | #159 | Good 28.9% |
| Japanese | 68.0 /100 | #160 | Good 28.9% |
| Immigrants | Cambodia | 66.6 /100 | #161 | Good 28.9% |
| Scandinavians | 66.2 /100 | #162 | Good 28.9% |
| Immigrants | Nigeria | 65.9 /100 | #163 | Good 28.9% |
Demographics Similar to Immigrants from Norway by Single Mother Poverty
In terms of single mother poverty, the demographic groups most similar to Immigrants from Norway are Immigrants from Uzbekistan (29.3%, a difference of 0.050%), Canadian (29.3%, a difference of 0.060%), South American Indian (29.3%, a difference of 0.090%), Immigrants from Eastern Africa (29.3%, a difference of 0.15%), and Nepalese (29.3%, a difference of 0.16%).
| Demographics | Rating | Rank | Single Mother Poverty |
| British | 50.6 /100 | #173 | Average 29.2% |
| Immigrants | Saudi Arabia | 50.0 /100 | #174 | Average 29.2% |
| Immigrants | Costa Rica | 48.8 /100 | #175 | Average 29.2% |
| Hawaiians | 47.8 /100 | #176 | Average 29.2% |
| Immigrants | Bosnia and Herzegovina | 45.1 /100 | #177 | Average 29.2% |
| South American Indians | 43.2 /100 | #178 | Average 29.3% |
| Immigrants | Uzbekistan | 42.6 /100 | #179 | Average 29.3% |
| Immigrants | Norway | 41.5 /100 | #180 | Average 29.3% |
| Canadians | 40.4 /100 | #181 | Average 29.3% |
| Immigrants | Eastern Africa | 38.5 /100 | #182 | Fair 29.3% |
| Nepalese | 38.3 /100 | #183 | Fair 29.3% |
| Nigerians | 38.0 /100 | #184 | Fair 29.3% |
| Ghanaians | 36.8 /100 | #185 | Fair 29.4% |
| Yugoslavians | 36.0 /100 | #186 | Fair 29.4% |
| Lebanese | 32.5 /100 | #187 | Fair 29.4% |