White/Caucasian vs Immigrants from Congo Single Mother Poverty
COMPARE
White/Caucasian
Immigrants from Congo
Single Mother Poverty
Single Mother Poverty Comparison
Whites/Caucasians
Immigrants from Congo
31.2%
SINGLE MOTHER POVERTY
0.3/ 100
METRIC RATING
260th/ 347
METRIC RANK
33.8%
SINGLE MOTHER POVERTY
0.0/ 100
METRIC RATING
306th/ 347
METRIC RANK
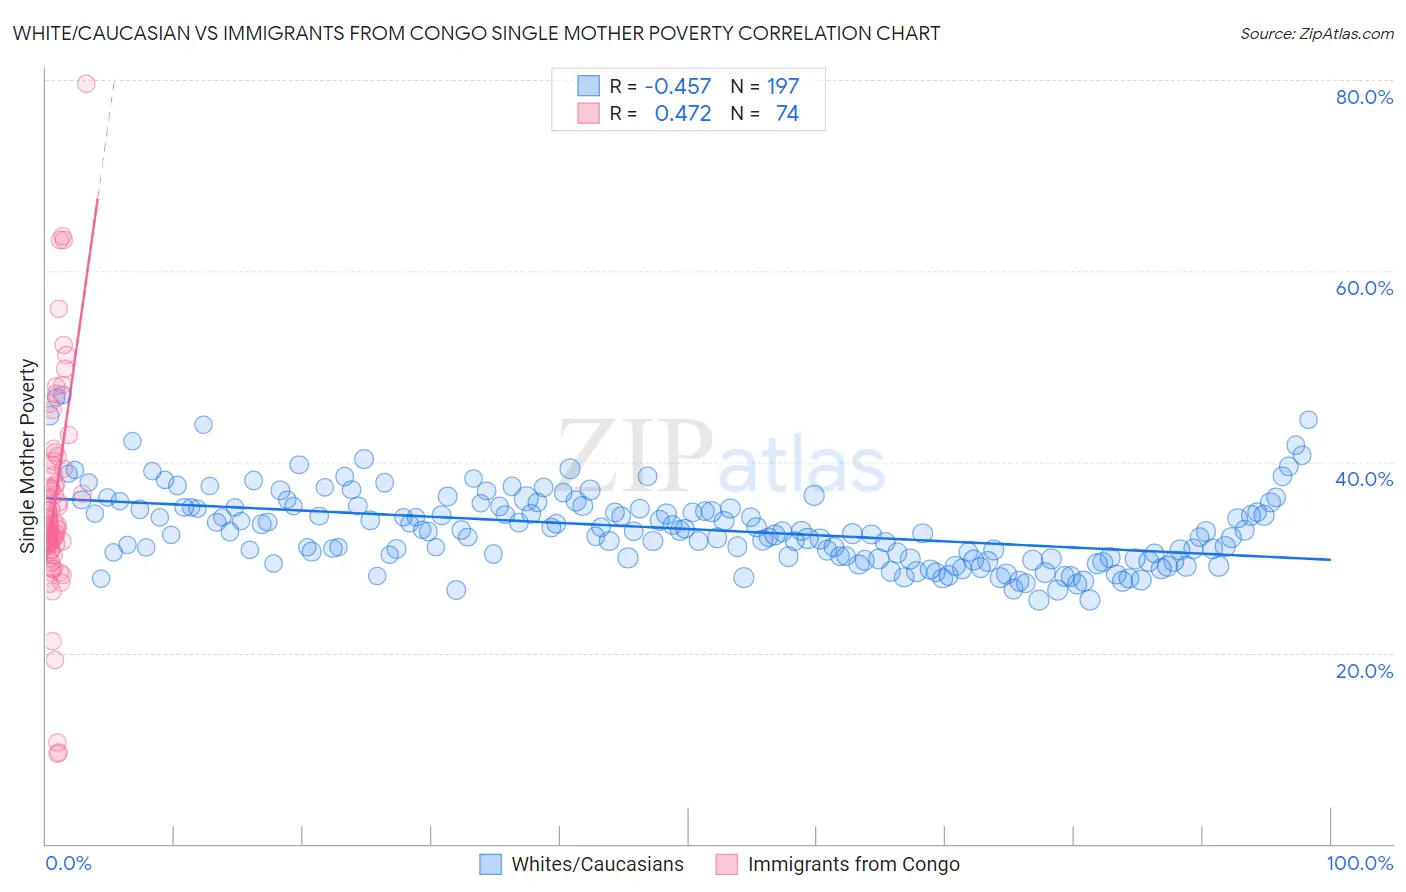
White/Caucasian vs Immigrants from Congo Single Mother Poverty Correlation Chart
The statistical analysis conducted on geographies consisting of 551,530,681 people shows a moderate negative correlation between the proportion of Whites/Caucasians and poverty level among single mothers in the United States with a correlation coefficient (R) of -0.457 and weighted average of 31.2%. Similarly, the statistical analysis conducted on geographies consisting of 91,894,688 people shows a moderate positive correlation between the proportion of Immigrants from Congo and poverty level among single mothers in the United States with a correlation coefficient (R) of 0.472 and weighted average of 33.8%, a difference of 8.4%.
Single Mother Poverty Correlation Summary
| Measurement | White/Caucasian | Immigrants from Congo |
| Minimum | 25.5% | 9.4% |
| Maximum | 47.0% | 79.6% |
| Range | 21.5% | 70.2% |
| Mean | 33.0% | 36.0% |
| Median | 32.7% | 33.4% |
| Interquartile 25% (IQ1) | 29.9% | 31.4% |
| Interquartile 75% (IQ3) | 35.3% | 39.7% |
| Interquartile Range (IQR) | 5.4% | 8.3% |
| Standard Deviation (Sample) | 4.0% | 11.4% |
| Standard Deviation (Population) | 4.0% | 11.4% |
Similar Demographics by Single Mother Poverty
Demographics Similar to Whites/Caucasians by Single Mother Poverty
In terms of single mother poverty, the demographic groups most similar to Whites/Caucasians are Immigrants from El Salvador (31.2%, a difference of 0.080%), Immigrants from Bangladesh (31.1%, a difference of 0.16%), Immigrants from Caribbean (31.1%, a difference of 0.19%), Hmong (31.2%, a difference of 0.21%), and Immigrants from Bahamas (31.1%, a difference of 0.28%).
| Demographics | Rating | Rank | Single Mother Poverty |
| Celtics | 0.6 /100 | #253 | Tragic 30.9% |
| Senegalese | 0.5 /100 | #254 | Tragic 31.0% |
| Belizeans | 0.5 /100 | #255 | Tragic 31.0% |
| Immigrants | West Indies | 0.4 /100 | #256 | Tragic 31.1% |
| Immigrants | Bahamas | 0.4 /100 | #257 | Tragic 31.1% |
| Immigrants | Caribbean | 0.4 /100 | #258 | Tragic 31.1% |
| Immigrants | Bangladesh | 0.4 /100 | #259 | Tragic 31.1% |
| Whites/Caucasians | 0.3 /100 | #260 | Tragic 31.2% |
| Immigrants | El Salvador | 0.3 /100 | #261 | Tragic 31.2% |
| Hmong | 0.3 /100 | #262 | Tragic 31.2% |
| Bahamians | 0.2 /100 | #263 | Tragic 31.3% |
| Immigrants | Ecuador | 0.2 /100 | #264 | Tragic 31.3% |
| German Russians | 0.2 /100 | #265 | Tragic 31.3% |
| Sub-Saharan Africans | 0.2 /100 | #266 | Tragic 31.4% |
| Immigrants | Belize | 0.2 /100 | #267 | Tragic 31.4% |
Demographics Similar to Immigrants from Congo by Single Mother Poverty
In terms of single mother poverty, the demographic groups most similar to Immigrants from Congo are Comanche (33.9%, a difference of 0.41%), Immigrants from Mexico (34.0%, a difference of 0.60%), Immigrants from Central America (33.6%, a difference of 0.64%), Mexican (33.6%, a difference of 0.68%), and American (33.5%, a difference of 0.78%).
| Demographics | Rating | Rank | Single Mother Poverty |
| Immigrants | Guatemala | 0.0 /100 | #299 | Tragic 33.3% |
| Hispanics or Latinos | 0.0 /100 | #300 | Tragic 33.3% |
| Immigrants | Somalia | 0.0 /100 | #301 | Tragic 33.4% |
| Arapaho | 0.0 /100 | #302 | Tragic 33.4% |
| Americans | 0.0 /100 | #303 | Tragic 33.5% |
| Mexicans | 0.0 /100 | #304 | Tragic 33.6% |
| Immigrants | Central America | 0.0 /100 | #305 | Tragic 33.6% |
| Immigrants | Congo | 0.0 /100 | #306 | Tragic 33.8% |
| Comanche | 0.0 /100 | #307 | Tragic 33.9% |
| Immigrants | Mexico | 0.0 /100 | #308 | Tragic 34.0% |
| Potawatomi | 0.0 /100 | #309 | Tragic 34.1% |
| Hondurans | 0.0 /100 | #310 | Tragic 34.2% |
| Alsatians | 0.0 /100 | #311 | Tragic 34.3% |
| Central American Indians | 0.0 /100 | #312 | Tragic 34.3% |
| Immigrants | Dominican Republic | 0.0 /100 | #313 | Tragic 34.4% |