Aleut vs Immigrants from Congo Single Mother Poverty
COMPARE
Aleut
Immigrants from Congo
Single Mother Poverty
Single Mother Poverty Comparison
Aleuts
Immigrants from Congo
32.9%
SINGLE MOTHER POVERTY
0.0/ 100
METRIC RATING
293rd/ 347
METRIC RANK
33.8%
SINGLE MOTHER POVERTY
0.0/ 100
METRIC RATING
306th/ 347
METRIC RANK
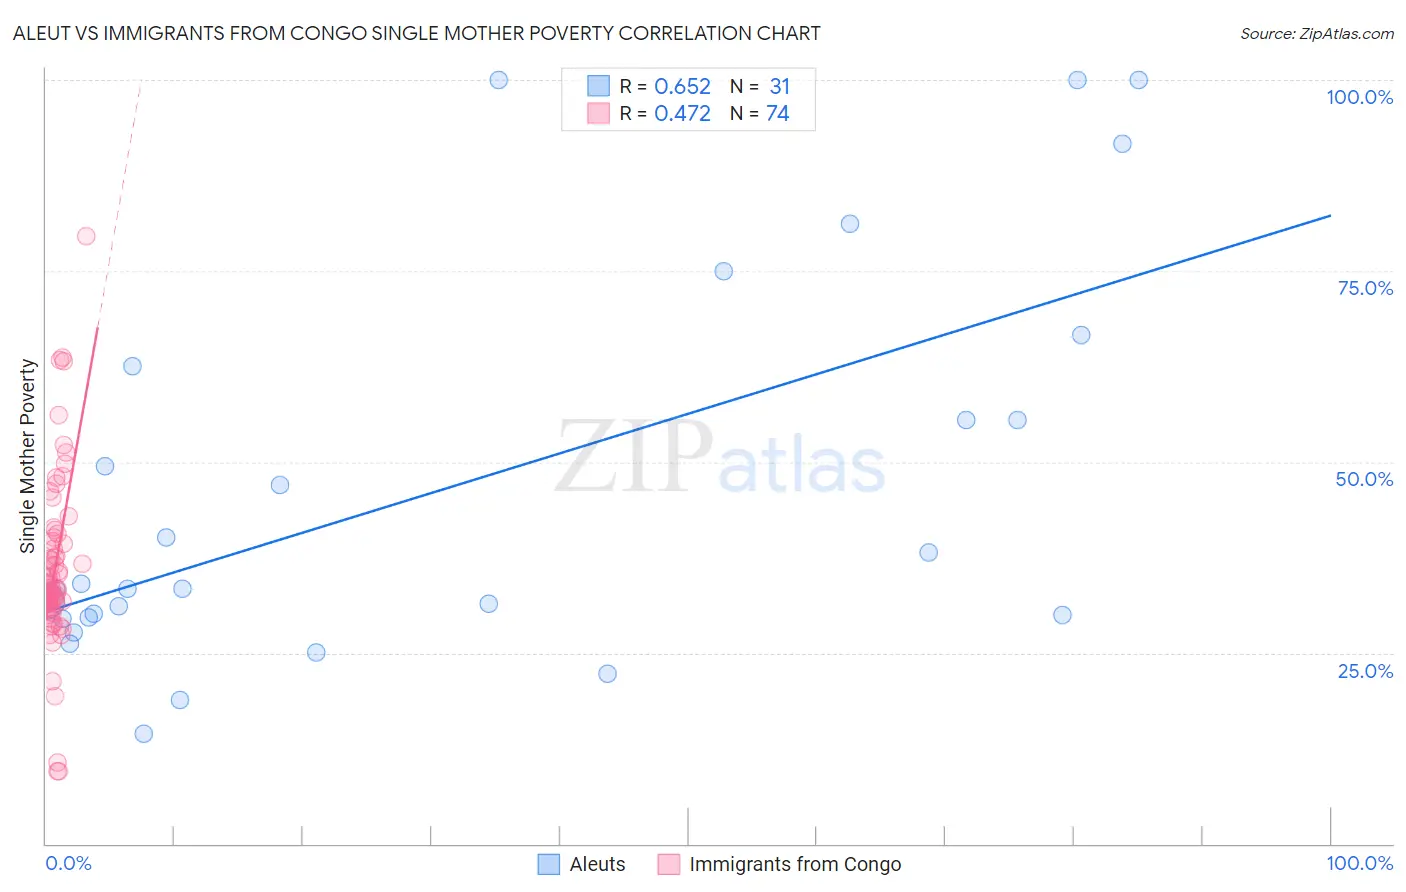
Aleut vs Immigrants from Congo Single Mother Poverty Correlation Chart
The statistical analysis conducted on geographies consisting of 61,416,159 people shows a significant positive correlation between the proportion of Aleuts and poverty level among single mothers in the United States with a correlation coefficient (R) of 0.652 and weighted average of 32.9%. Similarly, the statistical analysis conducted on geographies consisting of 91,894,688 people shows a moderate positive correlation between the proportion of Immigrants from Congo and poverty level among single mothers in the United States with a correlation coefficient (R) of 0.472 and weighted average of 33.8%, a difference of 2.6%.
Single Mother Poverty Correlation Summary
| Measurement | Aleut | Immigrants from Congo |
| Minimum | 14.4% | 9.4% |
| Maximum | 100.0% | 79.6% |
| Range | 85.6% | 70.2% |
| Mean | 46.6% | 36.0% |
| Median | 33.4% | 33.4% |
| Interquartile 25% (IQ1) | 29.6% | 31.4% |
| Interquartile 75% (IQ3) | 62.5% | 39.7% |
| Interquartile Range (IQR) | 32.9% | 8.3% |
| Standard Deviation (Sample) | 25.6% | 11.4% |
| Standard Deviation (Population) | 25.2% | 11.4% |
Demographics Similar to Aleuts and Immigrants from Congo by Single Mother Poverty
In terms of single mother poverty, the demographic groups most similar to Aleuts are Shoshone (32.9%, a difference of 0.030%), Guatemalan (32.9%, a difference of 0.050%), French American Indian (33.1%, a difference of 0.63%), Yaqui (33.1%, a difference of 0.66%), and Blackfeet (33.2%, a difference of 0.82%). Similarly, the demographic groups most similar to Immigrants from Congo are Comanche (33.9%, a difference of 0.41%), Immigrants from Mexico (34.0%, a difference of 0.60%), Immigrants from Central America (33.6%, a difference of 0.64%), Mexican (33.6%, a difference of 0.68%), and American (33.5%, a difference of 0.78%).
| Demographics | Rating | Rank | Single Mother Poverty |
| U.S. Virgin Islanders | 0.0 /100 | #289 | Tragic 32.6% |
| Osage | 0.0 /100 | #290 | Tragic 32.6% |
| Guatemalans | 0.0 /100 | #291 | Tragic 32.9% |
| Shoshone | 0.0 /100 | #292 | Tragic 32.9% |
| Aleuts | 0.0 /100 | #293 | Tragic 32.9% |
| French American Indians | 0.0 /100 | #294 | Tragic 33.1% |
| Yaqui | 0.0 /100 | #295 | Tragic 33.1% |
| Blackfeet | 0.0 /100 | #296 | Tragic 33.2% |
| Pennsylvania Germans | 0.0 /100 | #297 | Tragic 33.2% |
| Africans | 0.0 /100 | #298 | Tragic 33.3% |
| Immigrants | Guatemala | 0.0 /100 | #299 | Tragic 33.3% |
| Hispanics or Latinos | 0.0 /100 | #300 | Tragic 33.3% |
| Immigrants | Somalia | 0.0 /100 | #301 | Tragic 33.4% |
| Arapaho | 0.0 /100 | #302 | Tragic 33.4% |
| Americans | 0.0 /100 | #303 | Tragic 33.5% |
| Mexicans | 0.0 /100 | #304 | Tragic 33.6% |
| Immigrants | Central America | 0.0 /100 | #305 | Tragic 33.6% |
| Immigrants | Congo | 0.0 /100 | #306 | Tragic 33.8% |
| Comanche | 0.0 /100 | #307 | Tragic 33.9% |
| Immigrants | Mexico | 0.0 /100 | #308 | Tragic 34.0% |
| Potawatomi | 0.0 /100 | #309 | Tragic 34.1% |