Assyrian/Chaldean/Syriac vs Immigrants from Congo Single Mother Poverty
COMPARE
Assyrian/Chaldean/Syriac
Immigrants from Congo
Single Mother Poverty
Single Mother Poverty Comparison
Assyrians/Chaldeans/Syriacs
Immigrants from Congo
23.8%
SINGLE MOTHER POVERTY
100.0/ 100
METRIC RATING
1st/ 347
METRIC RANK
33.8%
SINGLE MOTHER POVERTY
0.0/ 100
METRIC RATING
306th/ 347
METRIC RANK
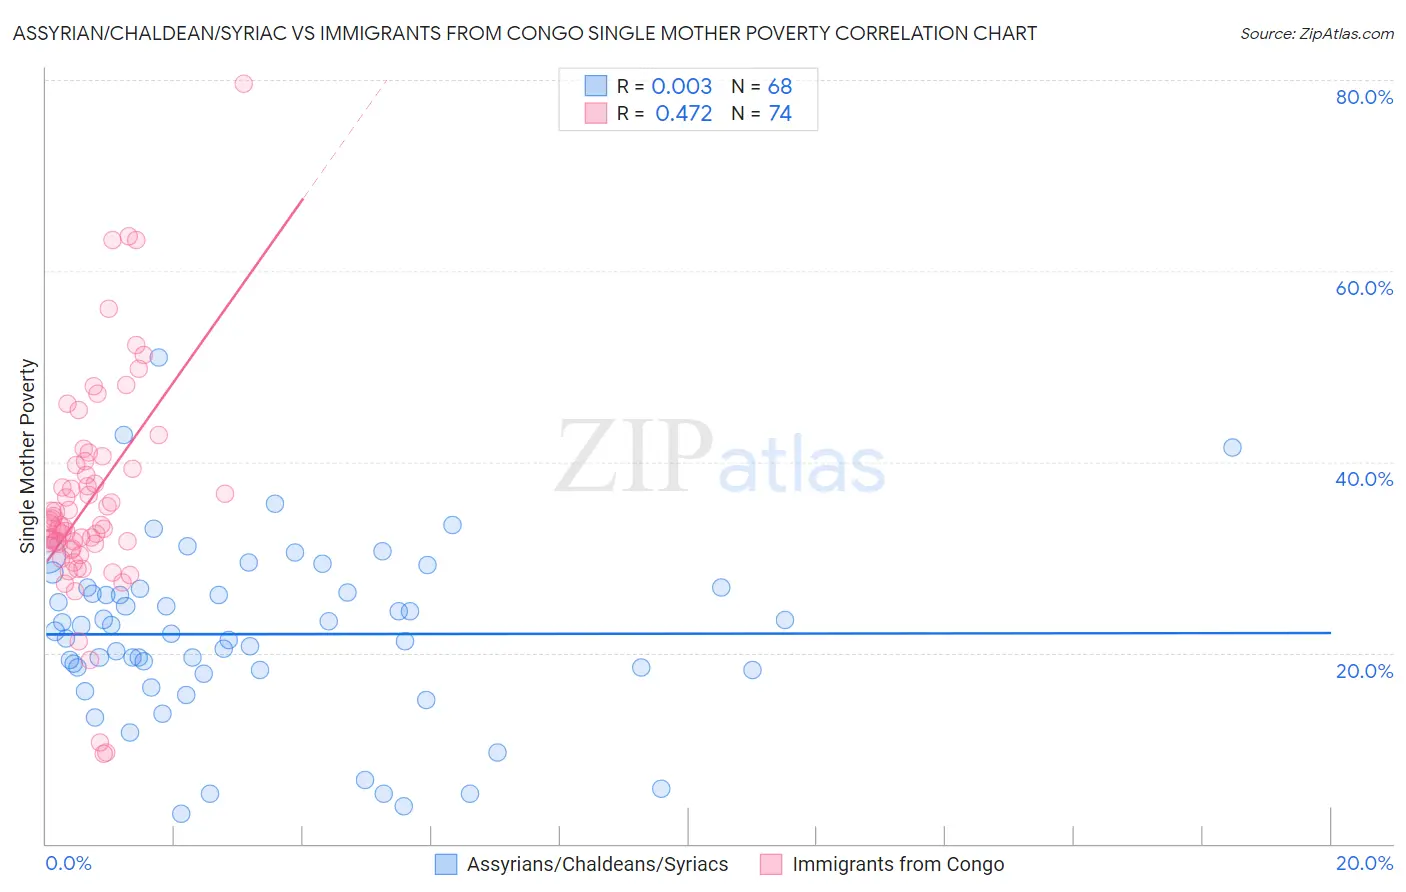
Assyrian/Chaldean/Syriac vs Immigrants from Congo Single Mother Poverty Correlation Chart
The statistical analysis conducted on geographies consisting of 109,112,991 people shows no correlation between the proportion of Assyrians/Chaldeans/Syriacs and poverty level among single mothers in the United States with a correlation coefficient (R) of 0.003 and weighted average of 23.8%. Similarly, the statistical analysis conducted on geographies consisting of 91,894,688 people shows a moderate positive correlation between the proportion of Immigrants from Congo and poverty level among single mothers in the United States with a correlation coefficient (R) of 0.472 and weighted average of 33.8%, a difference of 41.9%.
Single Mother Poverty Correlation Summary
| Measurement | Assyrian/Chaldean/Syriac | Immigrants from Congo |
| Minimum | 3.1% | 9.4% |
| Maximum | 50.9% | 79.6% |
| Range | 47.8% | 70.2% |
| Mean | 22.0% | 36.0% |
| Median | 22.1% | 33.4% |
| Interquartile 25% (IQ1) | 18.2% | 31.4% |
| Interquartile 75% (IQ3) | 26.5% | 39.7% |
| Interquartile Range (IQR) | 8.3% | 8.3% |
| Standard Deviation (Sample) | 9.1% | 11.4% |
| Standard Deviation (Population) | 9.0% | 11.4% |
Similar Demographics by Single Mother Poverty
Demographics Similar to Assyrians/Chaldeans/Syriacs by Single Mother Poverty
In terms of single mother poverty, the demographic groups most similar to Assyrians/Chaldeans/Syriacs are Immigrants from India (23.8%, a difference of 0.020%), Immigrants from Taiwan (23.9%, a difference of 0.21%), Filipino (24.3%, a difference of 2.1%), Immigrants from Hong Kong (24.4%, a difference of 2.4%), and Thai (24.5%, a difference of 2.9%).
| Demographics | Rating | Rank | Single Mother Poverty |
| Assyrians/Chaldeans/Syriacs | 100.0 /100 | #1 | Exceptional 23.8% |
| Immigrants | India | 100.0 /100 | #2 | Exceptional 23.8% |
| Immigrants | Taiwan | 100.0 /100 | #3 | Exceptional 23.9% |
| Filipinos | 100.0 /100 | #4 | Exceptional 24.3% |
| Immigrants | Hong Kong | 100.0 /100 | #5 | Exceptional 24.4% |
| Thais | 100.0 /100 | #6 | Exceptional 24.5% |
| Chinese | 100.0 /100 | #7 | Exceptional 24.6% |
| Immigrants | Iran | 100.0 /100 | #8 | Exceptional 25.1% |
| Immigrants | Lithuania | 100.0 /100 | #9 | Exceptional 25.2% |
| Immigrants | South Central Asia | 100.0 /100 | #10 | Exceptional 25.3% |
| Iranians | 100.0 /100 | #11 | Exceptional 25.5% |
| Bhutanese | 100.0 /100 | #12 | Exceptional 25.6% |
| Indians (Asian) | 100.0 /100 | #13 | Exceptional 25.8% |
| Immigrants | Singapore | 100.0 /100 | #14 | Exceptional 25.8% |
| Immigrants | Ireland | 100.0 /100 | #15 | Exceptional 25.8% |
Demographics Similar to Immigrants from Congo by Single Mother Poverty
In terms of single mother poverty, the demographic groups most similar to Immigrants from Congo are Comanche (33.9%, a difference of 0.41%), Immigrants from Mexico (34.0%, a difference of 0.60%), Immigrants from Central America (33.6%, a difference of 0.64%), Mexican (33.6%, a difference of 0.68%), and American (33.5%, a difference of 0.78%).
| Demographics | Rating | Rank | Single Mother Poverty |
| Immigrants | Guatemala | 0.0 /100 | #299 | Tragic 33.3% |
| Hispanics or Latinos | 0.0 /100 | #300 | Tragic 33.3% |
| Immigrants | Somalia | 0.0 /100 | #301 | Tragic 33.4% |
| Arapaho | 0.0 /100 | #302 | Tragic 33.4% |
| Americans | 0.0 /100 | #303 | Tragic 33.5% |
| Mexicans | 0.0 /100 | #304 | Tragic 33.6% |
| Immigrants | Central America | 0.0 /100 | #305 | Tragic 33.6% |
| Immigrants | Congo | 0.0 /100 | #306 | Tragic 33.8% |
| Comanche | 0.0 /100 | #307 | Tragic 33.9% |
| Immigrants | Mexico | 0.0 /100 | #308 | Tragic 34.0% |
| Potawatomi | 0.0 /100 | #309 | Tragic 34.1% |
| Hondurans | 0.0 /100 | #310 | Tragic 34.2% |
| Alsatians | 0.0 /100 | #311 | Tragic 34.3% |
| Central American Indians | 0.0 /100 | #312 | Tragic 34.3% |
| Immigrants | Dominican Republic | 0.0 /100 | #313 | Tragic 34.4% |