Tohono O'odham vs Immigrants from Congo Single Mother Poverty
COMPARE
Tohono O'odham
Immigrants from Congo
Single Mother Poverty
Single Mother Poverty Comparison
Tohono O'odham
Immigrants from Congo
43.0%
SINGLE MOTHER POVERTY
0.0/ 100
METRIC RATING
344th/ 347
METRIC RANK
33.8%
SINGLE MOTHER POVERTY
0.0/ 100
METRIC RATING
306th/ 347
METRIC RANK
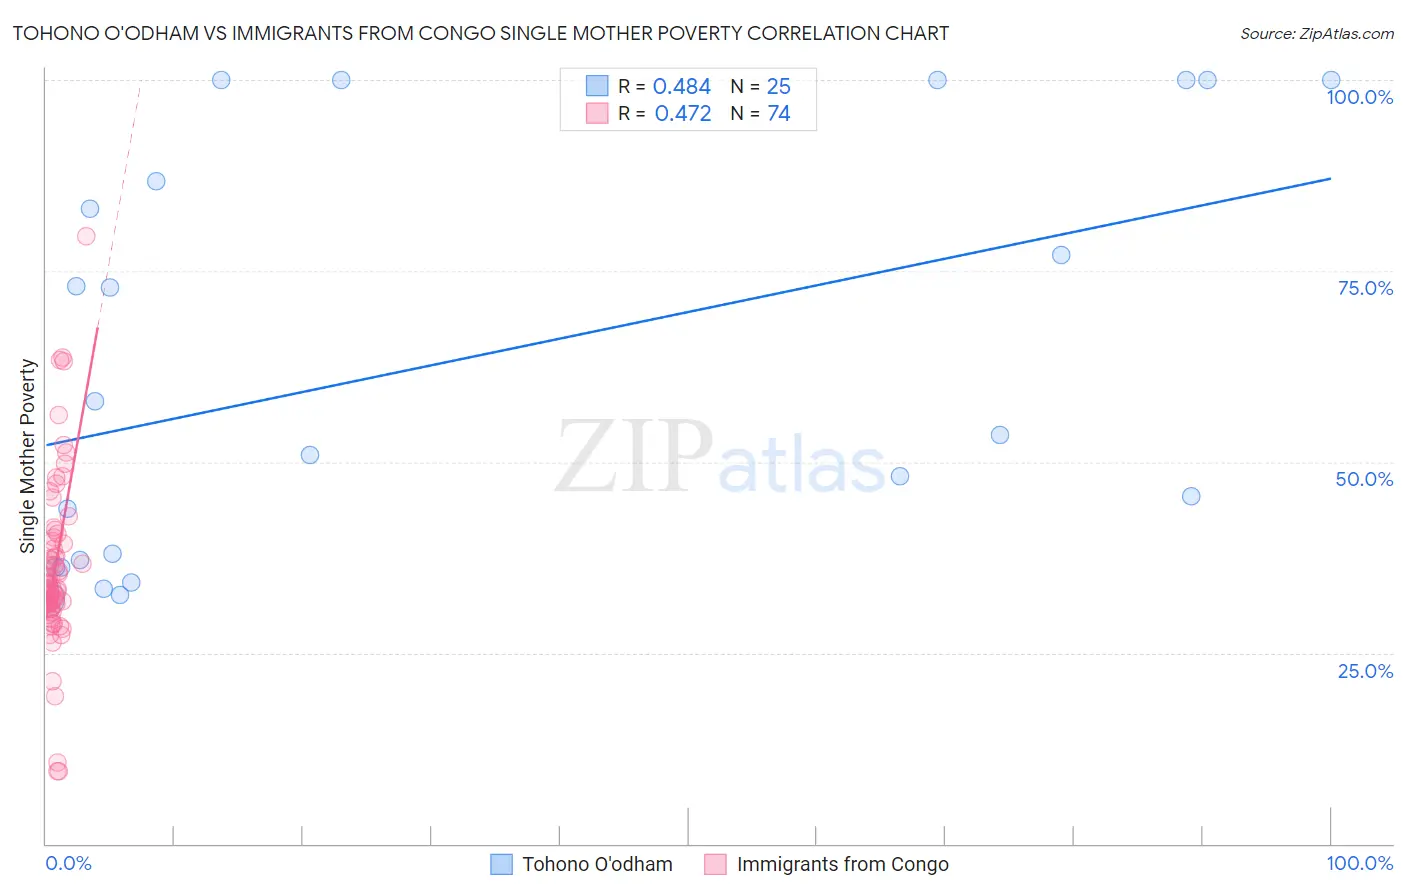
Tohono O'odham vs Immigrants from Congo Single Mother Poverty Correlation Chart
The statistical analysis conducted on geographies consisting of 58,556,531 people shows a moderate positive correlation between the proportion of Tohono O'odham and poverty level among single mothers in the United States with a correlation coefficient (R) of 0.484 and weighted average of 43.0%. Similarly, the statistical analysis conducted on geographies consisting of 91,894,688 people shows a moderate positive correlation between the proportion of Immigrants from Congo and poverty level among single mothers in the United States with a correlation coefficient (R) of 0.472 and weighted average of 33.8%, a difference of 27.4%.
Single Mother Poverty Correlation Summary
| Measurement | Tohono O'odham | Immigrants from Congo |
| Minimum | 32.1% | 9.4% |
| Maximum | 100.0% | 79.6% |
| Range | 67.9% | 70.2% |
| Mean | 62.9% | 36.0% |
| Median | 53.5% | 33.4% |
| Interquartile 25% (IQ1) | 36.6% | 31.4% |
| Interquartile 75% (IQ3) | 93.4% | 39.7% |
| Interquartile Range (IQR) | 56.8% | 8.3% |
| Standard Deviation (Sample) | 26.7% | 11.4% |
| Standard Deviation (Population) | 26.1% | 11.4% |
Similar Demographics by Single Mother Poverty
Demographics Similar to Tohono O'odham by Single Mother Poverty
In terms of single mother poverty, the demographic groups most similar to Tohono O'odham are Lumbee (43.2%, a difference of 0.49%), Houma (43.5%, a difference of 1.1%), Puerto Rican (44.5%, a difference of 3.5%), Cajun (40.3%, a difference of 6.7%), and Navajo (40.2%, a difference of 7.0%).
| Demographics | Rating | Rank | Single Mother Poverty |
| Menominee | 0.0 /100 | #333 | Tragic 37.1% |
| Pueblo | 0.0 /100 | #334 | Tragic 37.2% |
| Yuman | 0.0 /100 | #335 | Tragic 37.8% |
| Cheyenne | 0.0 /100 | #336 | Tragic 38.5% |
| Immigrants | Yemen | 0.0 /100 | #337 | Tragic 38.5% |
| Pima | 0.0 /100 | #338 | Tragic 38.6% |
| Crow | 0.0 /100 | #339 | Tragic 38.6% |
| Sioux | 0.0 /100 | #340 | Tragic 38.8% |
| Colville | 0.0 /100 | #341 | Tragic 39.3% |
| Navajo | 0.0 /100 | #342 | Tragic 40.2% |
| Cajuns | 0.0 /100 | #343 | Tragic 40.3% |
| Tohono O'odham | 0.0 /100 | #344 | Tragic 43.0% |
| Lumbee | 0.0 /100 | #345 | Tragic 43.2% |
| Houma | 0.0 /100 | #346 | Tragic 43.5% |
| Puerto Ricans | 0.0 /100 | #347 | Tragic 44.5% |
Demographics Similar to Immigrants from Congo by Single Mother Poverty
In terms of single mother poverty, the demographic groups most similar to Immigrants from Congo are Comanche (33.9%, a difference of 0.41%), Immigrants from Mexico (34.0%, a difference of 0.60%), Immigrants from Central America (33.6%, a difference of 0.64%), Mexican (33.6%, a difference of 0.68%), and American (33.5%, a difference of 0.78%).
| Demographics | Rating | Rank | Single Mother Poverty |
| Immigrants | Guatemala | 0.0 /100 | #299 | Tragic 33.3% |
| Hispanics or Latinos | 0.0 /100 | #300 | Tragic 33.3% |
| Immigrants | Somalia | 0.0 /100 | #301 | Tragic 33.4% |
| Arapaho | 0.0 /100 | #302 | Tragic 33.4% |
| Americans | 0.0 /100 | #303 | Tragic 33.5% |
| Mexicans | 0.0 /100 | #304 | Tragic 33.6% |
| Immigrants | Central America | 0.0 /100 | #305 | Tragic 33.6% |
| Immigrants | Congo | 0.0 /100 | #306 | Tragic 33.8% |
| Comanche | 0.0 /100 | #307 | Tragic 33.9% |
| Immigrants | Mexico | 0.0 /100 | #308 | Tragic 34.0% |
| Potawatomi | 0.0 /100 | #309 | Tragic 34.1% |
| Hondurans | 0.0 /100 | #310 | Tragic 34.2% |
| Alsatians | 0.0 /100 | #311 | Tragic 34.3% |
| Central American Indians | 0.0 /100 | #312 | Tragic 34.3% |
| Immigrants | Dominican Republic | 0.0 /100 | #313 | Tragic 34.4% |