Bahamian vs Immigrants from Latvia Median Household Income
COMPARE
Bahamian
Immigrants from Latvia
Median Household Income
Median Household Income Comparison
Bahamians
Immigrants from Latvia
$69,726
MEDIAN HOUSEHOLD INCOME
0.0/ 100
METRIC RATING
323rd/ 347
METRIC RANK
$93,602
MEDIAN HOUSEHOLD INCOME
99.6/ 100
METRIC RATING
74th/ 347
METRIC RANK
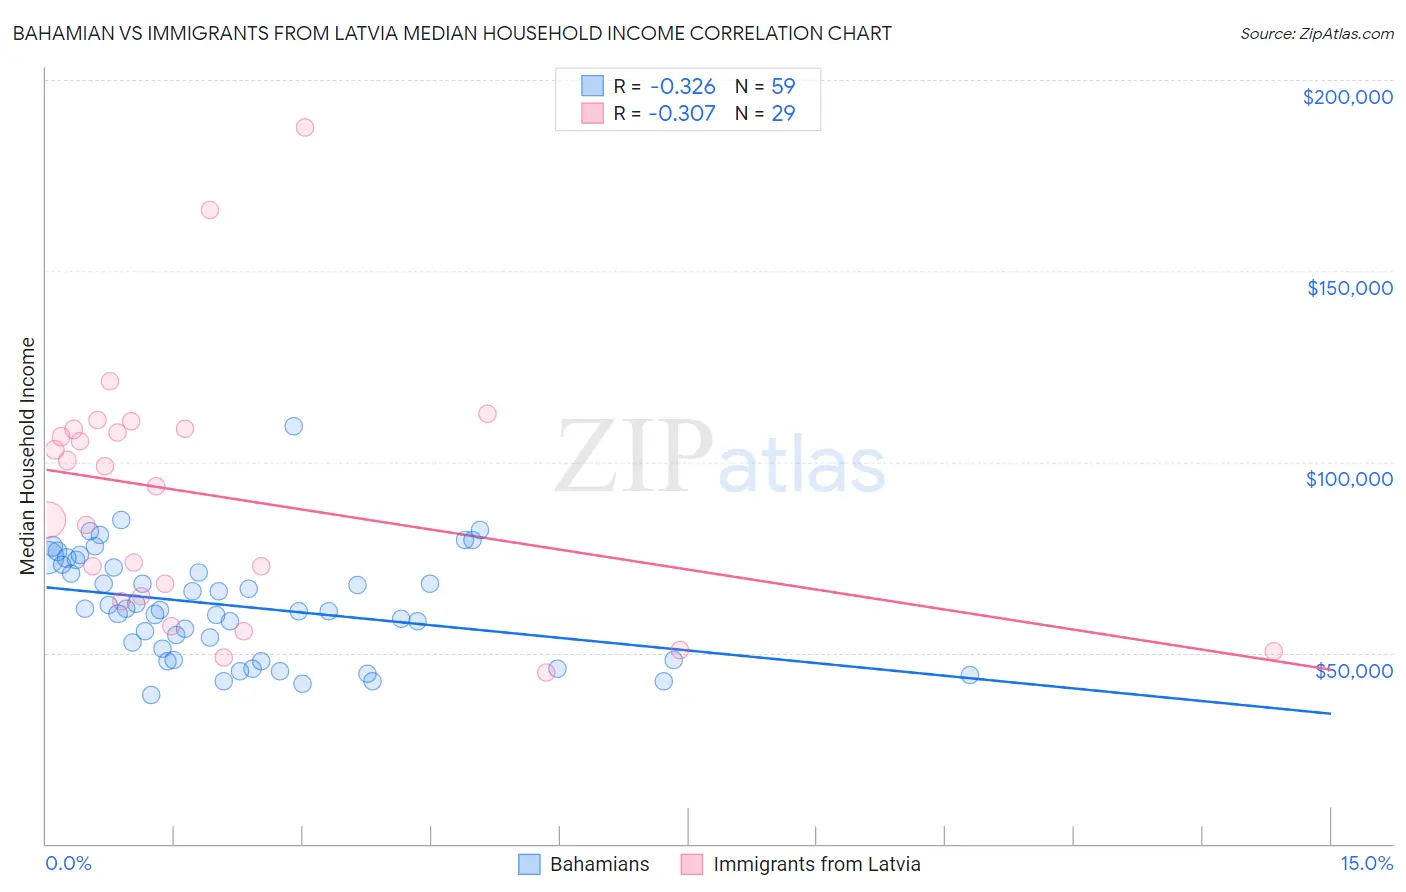
Bahamian vs Immigrants from Latvia Median Household Income Correlation Chart
The statistical analysis conducted on geographies consisting of 112,607,468 people shows a mild negative correlation between the proportion of Bahamians and median household income in the United States with a correlation coefficient (R) of -0.326 and weighted average of $69,726. Similarly, the statistical analysis conducted on geographies consisting of 113,726,313 people shows a mild negative correlation between the proportion of Immigrants from Latvia and median household income in the United States with a correlation coefficient (R) of -0.307 and weighted average of $93,602, a difference of 34.2%.
Median Household Income Correlation Summary
| Measurement | Bahamian | Immigrants from Latvia |
| Minimum | $38,952 | $44,737 |
| Maximum | $109,393 | $187,593 |
| Range | $70,441 | $142,856 |
| Mean | $62,193 | $90,790 |
| Median | $61,085 | $93,558 |
| Interquartile 25% (IQ1) | $48,214 | $64,215 |
| Interquartile 75% (IQ3) | $73,042 | $108,638 |
| Interquartile Range (IQR) | $24,828 | $44,423 |
| Standard Deviation (Sample) | $14,104 | $33,495 |
| Standard Deviation (Population) | $13,984 | $32,912 |
Similar Demographics by Median Household Income
Demographics Similar to Bahamians by Median Household Income
In terms of median household income, the demographic groups most similar to Bahamians are Yup'ik ($69,695, a difference of 0.040%), Choctaw ($69,947, a difference of 0.32%), Chickasaw ($70,005, a difference of 0.40%), Seminole ($69,420, a difference of 0.44%), and Colville ($70,094, a difference of 0.53%).
| Demographics | Rating | Rank | Median Household Income |
| Apache | 0.0 /100 | #316 | Tragic $70,927 |
| Cajuns | 0.0 /100 | #317 | Tragic $70,605 |
| Chippewa | 0.0 /100 | #318 | Tragic $70,539 |
| Immigrants | Dominican Republic | 0.0 /100 | #319 | Tragic $70,208 |
| Colville | 0.0 /100 | #320 | Tragic $70,094 |
| Chickasaw | 0.0 /100 | #321 | Tragic $70,005 |
| Choctaw | 0.0 /100 | #322 | Tragic $69,947 |
| Bahamians | 0.0 /100 | #323 | Tragic $69,726 |
| Yup'ik | 0.0 /100 | #324 | Tragic $69,695 |
| Seminole | 0.0 /100 | #325 | Tragic $69,420 |
| Yuman | 0.0 /100 | #326 | Tragic $68,743 |
| Immigrants | Cuba | 0.0 /100 | #327 | Tragic $68,461 |
| Menominee | 0.0 /100 | #328 | Tragic $68,423 |
| Dutch West Indians | 0.0 /100 | #329 | Tragic $68,412 |
| Arapaho | 0.0 /100 | #330 | Tragic $67,965 |
Demographics Similar to Immigrants from Latvia by Median Household Income
In terms of median household income, the demographic groups most similar to Immigrants from Latvia are Immigrants from Egypt ($93,700, a difference of 0.10%), Immigrants from Italy ($93,465, a difference of 0.15%), South African ($93,379, a difference of 0.24%), Immigrants from Afghanistan ($93,375, a difference of 0.24%), and Lithuanian ($93,852, a difference of 0.27%).
| Demographics | Rating | Rank | Median Household Income |
| Immigrants | Scotland | 99.7 /100 | #67 | Exceptional $94,091 |
| Mongolians | 99.7 /100 | #68 | Exceptional $93,971 |
| Argentineans | 99.7 /100 | #69 | Exceptional $93,960 |
| Immigrants | Fiji | 99.7 /100 | #70 | Exceptional $93,933 |
| Immigrants | Philippines | 99.6 /100 | #71 | Exceptional $93,899 |
| Lithuanians | 99.6 /100 | #72 | Exceptional $93,852 |
| Immigrants | Egypt | 99.6 /100 | #73 | Exceptional $93,700 |
| Immigrants | Latvia | 99.6 /100 | #74 | Exceptional $93,602 |
| Immigrants | Italy | 99.5 /100 | #75 | Exceptional $93,465 |
| South Africans | 99.5 /100 | #76 | Exceptional $93,379 |
| Immigrants | Afghanistan | 99.5 /100 | #77 | Exceptional $93,375 |
| Immigrants | Bulgaria | 99.4 /100 | #78 | Exceptional $93,148 |
| Sri Lankans | 99.4 /100 | #79 | Exceptional $93,093 |
| Tongans | 99.4 /100 | #80 | Exceptional $93,076 |
| Immigrants | Eastern Europe | 99.4 /100 | #81 | Exceptional $93,051 |