Austrian vs Ukrainian Single Female Poverty
COMPARE
Austrian
Ukrainian
Single Female Poverty
Single Female Poverty Comparison
Austrians
Ukrainians
20.4%
SINGLE FEMALE POVERTY
85.8/ 100
METRIC RATING
145th/ 347
METRIC RANK
19.8%
SINGLE FEMALE POVERTY
97.6/ 100
METRIC RATING
100th/ 347
METRIC RANK
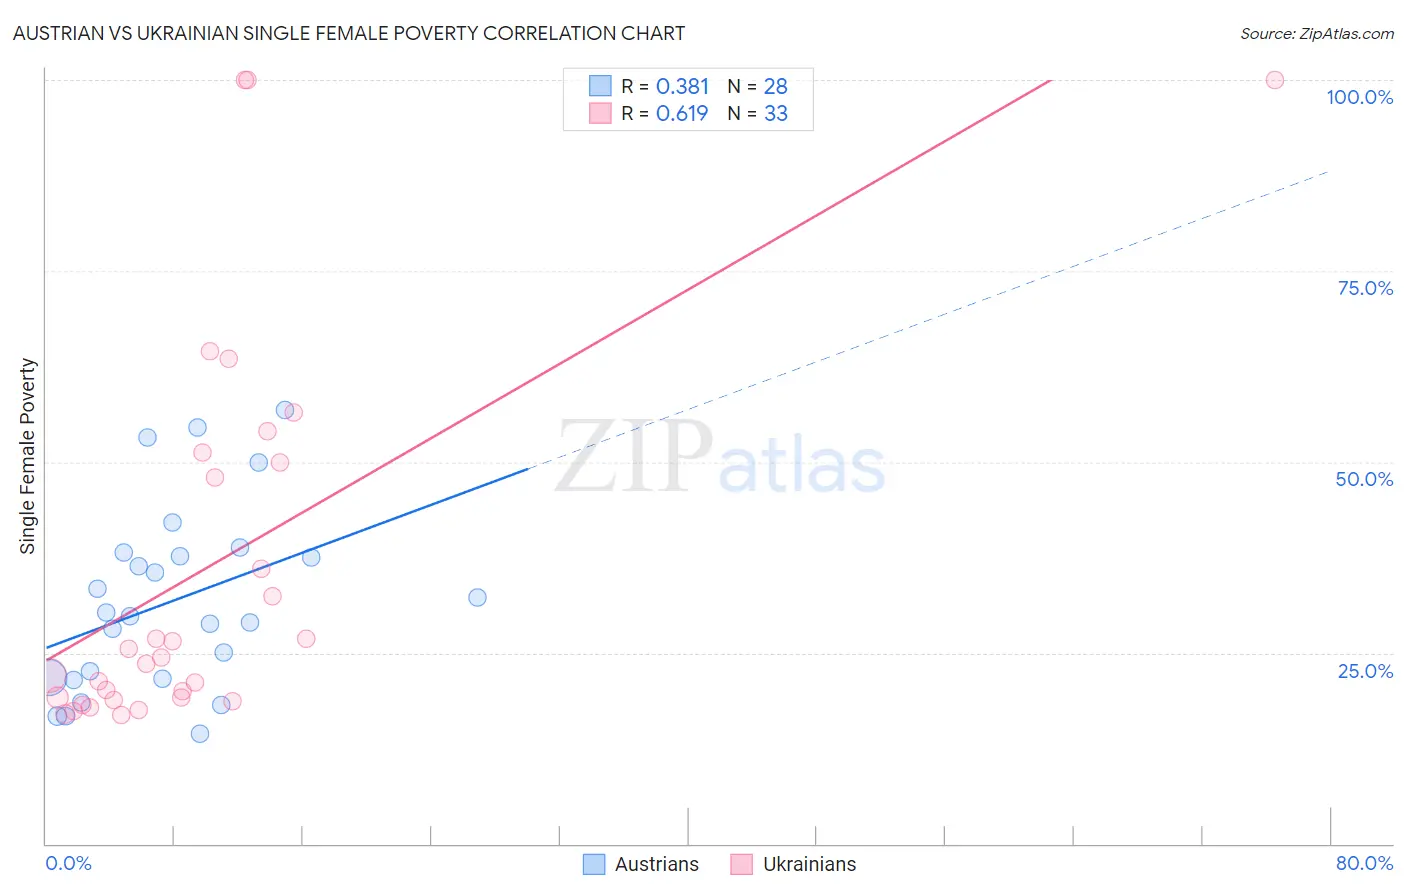
Austrian vs Ukrainian Single Female Poverty Correlation Chart
The statistical analysis conducted on geographies consisting of 441,015,533 people shows a mild positive correlation between the proportion of Austrians and poverty level among single females in the United States with a correlation coefficient (R) of 0.381 and weighted average of 20.4%. Similarly, the statistical analysis conducted on geographies consisting of 437,822,135 people shows a significant positive correlation between the proportion of Ukrainians and poverty level among single females in the United States with a correlation coefficient (R) of 0.619 and weighted average of 19.8%, a difference of 3.1%.
Single Female Poverty Correlation Summary
| Measurement | Austrian | Ukrainian |
| Minimum | 14.3% | 16.8% |
| Maximum | 56.8% | 100.0% |
| Range | 42.4% | 83.2% |
| Mean | 31.8% | 36.2% |
| Median | 30.1% | 24.4% |
| Interquartile 25% (IQ1) | 21.7% | 19.0% |
| Interquartile 75% (IQ3) | 37.9% | 50.6% |
| Interquartile Range (IQR) | 16.2% | 31.6% |
| Standard Deviation (Sample) | 11.9% | 25.1% |
| Standard Deviation (Population) | 11.7% | 24.8% |
Similar Demographics by Single Female Poverty
Demographics Similar to Austrians by Single Female Poverty
In terms of single female poverty, the demographic groups most similar to Austrians are Venezuelan (20.4%, a difference of 0.030%), South African (20.4%, a difference of 0.060%), Luxembourger (20.4%, a difference of 0.11%), Immigrants from Uzbekistan (20.3%, a difference of 0.36%), and Australian (20.3%, a difference of 0.37%).
| Demographics | Rating | Rank | Single Female Poverty |
| Slovenes | 90.5 /100 | #138 | Exceptional 20.3% |
| Immigrants | Kuwait | 90.4 /100 | #139 | Exceptional 20.3% |
| Syrians | 90.4 /100 | #140 | Exceptional 20.3% |
| Immigrants | North America | 89.5 /100 | #141 | Excellent 20.3% |
| Immigrants | Uganda | 89.1 /100 | #142 | Excellent 20.3% |
| Australians | 88.4 /100 | #143 | Excellent 20.3% |
| Immigrants | Uzbekistan | 88.3 /100 | #144 | Excellent 20.3% |
| Austrians | 85.8 /100 | #145 | Excellent 20.4% |
| Venezuelans | 85.5 /100 | #146 | Excellent 20.4% |
| South Africans | 85.3 /100 | #147 | Excellent 20.4% |
| Luxembourgers | 84.9 /100 | #148 | Excellent 20.4% |
| Portuguese | 81.5 /100 | #149 | Excellent 20.5% |
| Immigrants | Denmark | 80.5 /100 | #150 | Excellent 20.5% |
| Puget Sound Salish | 79.6 /100 | #151 | Good 20.6% |
| Immigrants | Uruguay | 77.7 /100 | #152 | Good 20.6% |
Demographics Similar to Ukrainians by Single Female Poverty
In terms of single female poverty, the demographic groups most similar to Ukrainians are Immigrants from Belgium (19.8%, a difference of 0.18%), Immigrants from Cameroon (19.8%, a difference of 0.19%), Sierra Leonean (19.7%, a difference of 0.25%), Immigrants from France (19.7%, a difference of 0.26%), and Immigrants from Southern Europe (19.9%, a difference of 0.31%).
| Demographics | Rating | Rank | Single Female Poverty |
| Immigrants | Austria | 98.8 /100 | #93 | Exceptional 19.6% |
| Romanians | 98.6 /100 | #94 | Exceptional 19.6% |
| Estonians | 98.2 /100 | #95 | Exceptional 19.7% |
| Immigrants | Brazil | 98.2 /100 | #96 | Exceptional 19.7% |
| Croatians | 98.1 /100 | #97 | Exceptional 19.7% |
| Immigrants | France | 97.9 /100 | #98 | Exceptional 19.7% |
| Sierra Leoneans | 97.9 /100 | #99 | Exceptional 19.7% |
| Ukrainians | 97.6 /100 | #100 | Exceptional 19.8% |
| Immigrants | Belgium | 97.3 /100 | #101 | Exceptional 19.8% |
| Immigrants | Cameroon | 97.3 /100 | #102 | Exceptional 19.8% |
| Immigrants | Southern Europe | 97.1 /100 | #103 | Exceptional 19.9% |
| Chileans | 96.9 /100 | #104 | Exceptional 19.9% |
| Israelis | 96.9 /100 | #105 | Exceptional 19.9% |
| Ethiopians | 96.7 /100 | #106 | Exceptional 19.9% |
| Immigrants | Syria | 96.7 /100 | #107 | Exceptional 19.9% |