Austrian vs Belizean Single Female Poverty
COMPARE
Austrian
Belizean
Single Female Poverty
Single Female Poverty Comparison
Austrians
Belizeans
20.4%
SINGLE FEMALE POVERTY
85.8/ 100
METRIC RATING
145th/ 347
METRIC RANK
22.4%
SINGLE FEMALE POVERTY
1.4/ 100
METRIC RATING
248th/ 347
METRIC RANK
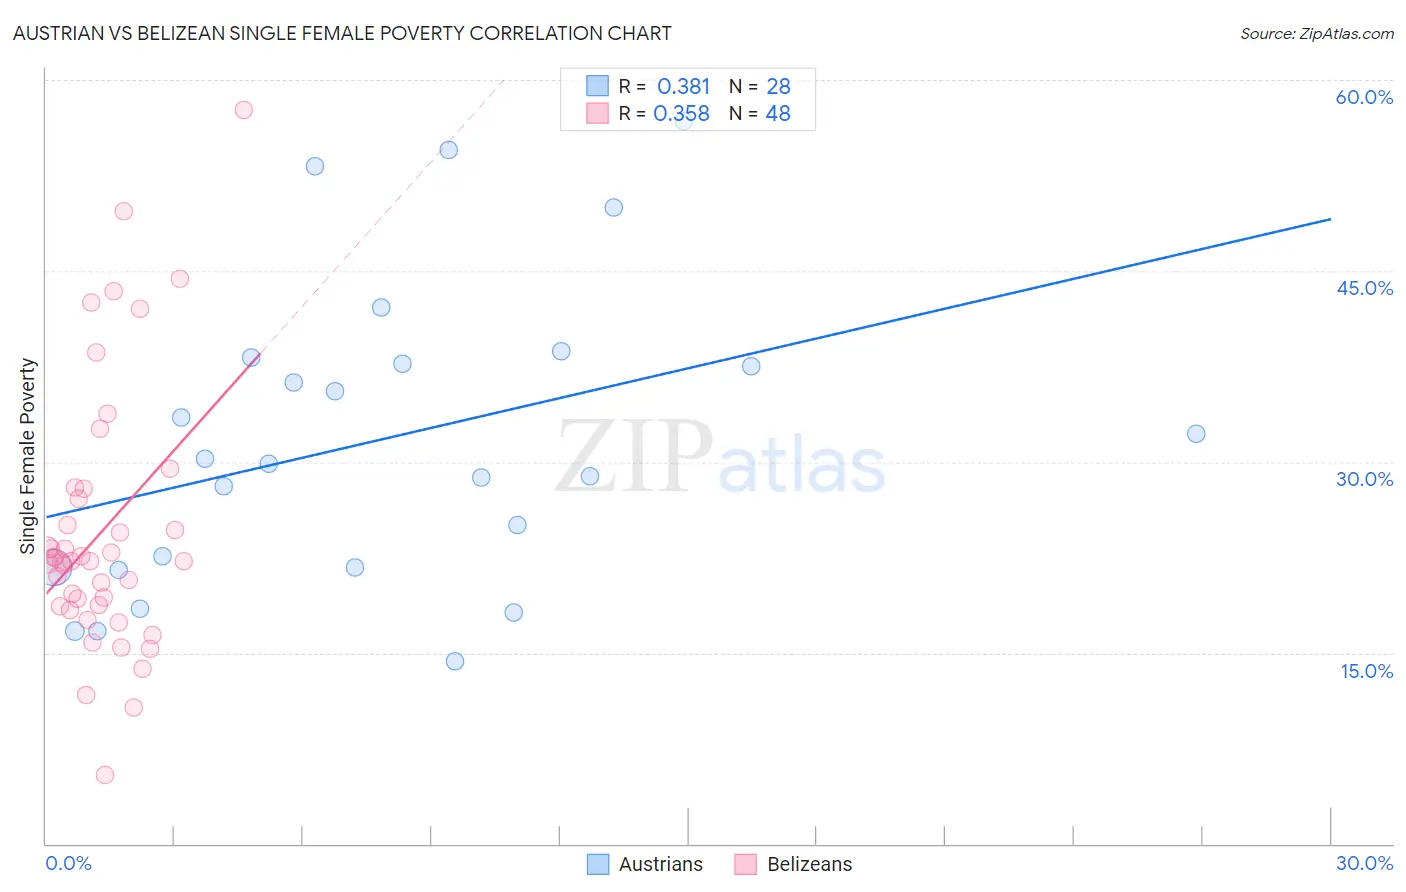
Austrian vs Belizean Single Female Poverty Correlation Chart
The statistical analysis conducted on geographies consisting of 441,015,533 people shows a mild positive correlation between the proportion of Austrians and poverty level among single females in the United States with a correlation coefficient (R) of 0.381 and weighted average of 20.4%. Similarly, the statistical analysis conducted on geographies consisting of 143,694,169 people shows a mild positive correlation between the proportion of Belizeans and poverty level among single females in the United States with a correlation coefficient (R) of 0.358 and weighted average of 22.4%, a difference of 9.7%.
Single Female Poverty Correlation Summary
| Measurement | Austrian | Belizean |
| Minimum | 14.3% | 5.4% |
| Maximum | 56.8% | 57.6% |
| Range | 42.4% | 52.3% |
| Mean | 31.8% | 24.6% |
| Median | 30.1% | 22.2% |
| Interquartile 25% (IQ1) | 21.7% | 18.7% |
| Interquartile 75% (IQ3) | 37.9% | 27.5% |
| Interquartile Range (IQR) | 16.2% | 8.8% |
| Standard Deviation (Sample) | 11.9% | 10.4% |
| Standard Deviation (Population) | 11.7% | 10.2% |
Similar Demographics by Single Female Poverty
Demographics Similar to Austrians by Single Female Poverty
In terms of single female poverty, the demographic groups most similar to Austrians are Venezuelan (20.4%, a difference of 0.030%), South African (20.4%, a difference of 0.060%), Luxembourger (20.4%, a difference of 0.11%), Immigrants from Uzbekistan (20.3%, a difference of 0.36%), and Australian (20.3%, a difference of 0.37%).
| Demographics | Rating | Rank | Single Female Poverty |
| Slovenes | 90.5 /100 | #138 | Exceptional 20.3% |
| Immigrants | Kuwait | 90.4 /100 | #139 | Exceptional 20.3% |
| Syrians | 90.4 /100 | #140 | Exceptional 20.3% |
| Immigrants | North America | 89.5 /100 | #141 | Excellent 20.3% |
| Immigrants | Uganda | 89.1 /100 | #142 | Excellent 20.3% |
| Australians | 88.4 /100 | #143 | Excellent 20.3% |
| Immigrants | Uzbekistan | 88.3 /100 | #144 | Excellent 20.3% |
| Austrians | 85.8 /100 | #145 | Excellent 20.4% |
| Venezuelans | 85.5 /100 | #146 | Excellent 20.4% |
| South Africans | 85.3 /100 | #147 | Excellent 20.4% |
| Luxembourgers | 84.9 /100 | #148 | Excellent 20.4% |
| Portuguese | 81.5 /100 | #149 | Excellent 20.5% |
| Immigrants | Denmark | 80.5 /100 | #150 | Excellent 20.5% |
| Puget Sound Salish | 79.6 /100 | #151 | Good 20.6% |
| Immigrants | Uruguay | 77.7 /100 | #152 | Good 20.6% |
Demographics Similar to Belizeans by Single Female Poverty
In terms of single female poverty, the demographic groups most similar to Belizeans are Immigrants from El Salvador (22.4%, a difference of 0.010%), Liberian (22.4%, a difference of 0.070%), Immigrants from Caribbean (22.4%, a difference of 0.10%), Immigrants from Bahamas (22.5%, a difference of 0.25%), and Immigrants from West Indies (22.5%, a difference of 0.39%).
| Demographics | Rating | Rank | Single Female Poverty |
| Cape Verdeans | 2.1 /100 | #241 | Tragic 22.3% |
| Bermudans | 2.0 /100 | #242 | Tragic 22.3% |
| West Indians | 1.9 /100 | #243 | Tragic 22.3% |
| Immigrants | Middle Africa | 1.9 /100 | #244 | Tragic 22.3% |
| Immigrants | Bangladesh | 1.8 /100 | #245 | Tragic 22.3% |
| Liberians | 1.4 /100 | #246 | Tragic 22.4% |
| Immigrants | El Salvador | 1.4 /100 | #247 | Tragic 22.4% |
| Belizeans | 1.4 /100 | #248 | Tragic 22.4% |
| Immigrants | Caribbean | 1.3 /100 | #249 | Tragic 22.4% |
| Immigrants | Bahamas | 1.2 /100 | #250 | Tragic 22.5% |
| Immigrants | West Indies | 1.0 /100 | #251 | Tragic 22.5% |
| Delaware | 1.0 /100 | #252 | Tragic 22.5% |
| Immigrants | Liberia | 0.9 /100 | #253 | Tragic 22.5% |
| Immigrants | Burma/Myanmar | 0.8 /100 | #254 | Tragic 22.6% |
| Immigrants | Sudan | 0.8 /100 | #255 | Tragic 22.6% |