Assyrian/Chaldean/Syriac vs Aleut Child Poverty Among Girls Under 16
COMPARE
Assyrian/Chaldean/Syriac
Aleut
Child Poverty Among Girls Under 16
Child Poverty Among Girls Under 16 Comparison
Assyrians/Chaldeans/Syriacs
Aleuts
13.3%
CHILD POVERTY AMONG GIRLS UNDER 16
99.9/ 100
METRIC RATING
21st/ 347
METRIC RANK
16.9%
CHILD POVERTY AMONG GIRLS UNDER 16
28.7/ 100
METRIC RATING
193rd/ 347
METRIC RANK
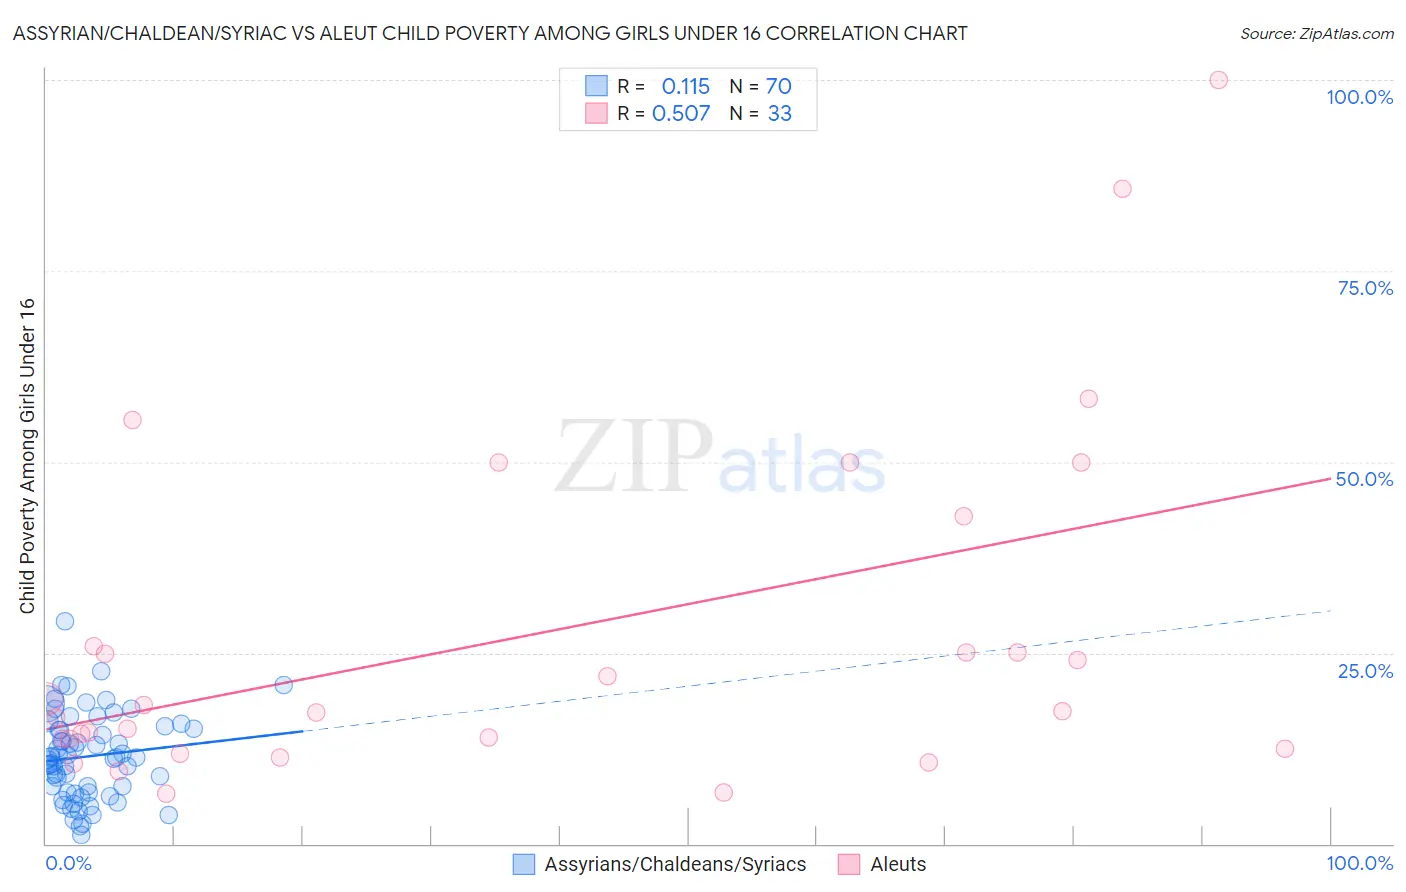
Assyrian/Chaldean/Syriac vs Aleut Child Poverty Among Girls Under 16 Correlation Chart
The statistical analysis conducted on geographies consisting of 109,412,963 people shows a poor positive correlation between the proportion of Assyrians/Chaldeans/Syriacs and poverty level among girls under the age of 16 in the United States with a correlation coefficient (R) of 0.115 and weighted average of 13.3%. Similarly, the statistical analysis conducted on geographies consisting of 61,541,696 people shows a substantial positive correlation between the proportion of Aleuts and poverty level among girls under the age of 16 in the United States with a correlation coefficient (R) of 0.507 and weighted average of 16.9%, a difference of 27.1%.
Child Poverty Among Girls Under 16 Correlation Summary
| Measurement | Assyrian/Chaldean/Syriac | Aleut |
| Minimum | 1.1% | 6.6% |
| Maximum | 29.1% | 100.0% |
| Range | 28.0% | 93.4% |
| Mean | 11.4% | 27.1% |
| Median | 11.3% | 17.4% |
| Interquartile 25% (IQ1) | 6.8% | 13.1% |
| Interquartile 75% (IQ3) | 15.0% | 34.4% |
| Interquartile Range (IQR) | 8.3% | 21.3% |
| Standard Deviation (Sample) | 5.6% | 22.5% |
| Standard Deviation (Population) | 5.5% | 22.2% |
Similar Demographics by Child Poverty Among Girls Under 16
Demographics Similar to Assyrians/Chaldeans/Syriacs by Child Poverty Among Girls Under 16
In terms of child poverty among girls under 16, the demographic groups most similar to Assyrians/Chaldeans/Syriacs are Immigrants from Japan (13.3%, a difference of 0.12%), Indian (Asian) (13.3%, a difference of 0.20%), Norwegian (13.3%, a difference of 0.37%), Immigrants from Eastern Asia (13.4%, a difference of 0.46%), and Cypriot (13.2%, a difference of 0.78%).
| Demographics | Rating | Rank | Child Poverty Among Girls Under 16 |
| Burmese | 99.9 /100 | #14 | Exceptional 13.0% |
| Okinawans | 99.9 /100 | #15 | Exceptional 13.0% |
| Immigrants | Lithuania | 99.9 /100 | #16 | Exceptional 13.1% |
| Bulgarians | 99.9 /100 | #17 | Exceptional 13.1% |
| Immigrants | Korea | 99.9 /100 | #18 | Exceptional 13.1% |
| Cypriots | 99.9 /100 | #19 | Exceptional 13.2% |
| Immigrants | Japan | 99.9 /100 | #20 | Exceptional 13.3% |
| Assyrians/Chaldeans/Syriacs | 99.9 /100 | #21 | Exceptional 13.3% |
| Indians (Asian) | 99.9 /100 | #22 | Exceptional 13.3% |
| Norwegians | 99.9 /100 | #23 | Exceptional 13.3% |
| Immigrants | Eastern Asia | 99.9 /100 | #24 | Exceptional 13.4% |
| Immigrants | China | 99.8 /100 | #25 | Exceptional 13.4% |
| Eastern Europeans | 99.8 /100 | #26 | Exceptional 13.5% |
| Latvians | 99.8 /100 | #27 | Exceptional 13.5% |
| Tongans | 99.8 /100 | #28 | Exceptional 13.6% |
Demographics Similar to Aleuts by Child Poverty Among Girls Under 16
In terms of child poverty among girls under 16, the demographic groups most similar to Aleuts are Spanish (16.9%, a difference of 0.010%), Immigrants from Uganda (16.8%, a difference of 0.34%), Immigrants from the Azores (16.8%, a difference of 0.35%), Immigrants from Costa Rica (17.0%, a difference of 0.44%), and Kenyan (16.8%, a difference of 0.47%).
| Demographics | Rating | Rank | Child Poverty Among Girls Under 16 |
| South American Indians | 35.0 /100 | #186 | Fair 16.8% |
| Immigrants | Morocco | 34.6 /100 | #187 | Fair 16.8% |
| Arabs | 34.5 /100 | #188 | Fair 16.8% |
| Immigrants | Bosnia and Herzegovina | 32.5 /100 | #189 | Fair 16.8% |
| Kenyans | 32.3 /100 | #190 | Fair 16.8% |
| Immigrants | Azores | 31.3 /100 | #191 | Fair 16.8% |
| Immigrants | Uganda | 31.3 /100 | #192 | Fair 16.8% |
| Aleuts | 28.7 /100 | #193 | Fair 16.9% |
| Spanish | 28.6 /100 | #194 | Fair 16.9% |
| Immigrants | Costa Rica | 25.6 /100 | #195 | Fair 17.0% |
| Celtics | 25.2 /100 | #196 | Fair 17.0% |
| Spaniards | 24.9 /100 | #197 | Fair 17.0% |
| Immigrants | Lebanon | 22.6 /100 | #198 | Fair 17.1% |
| Immigrants | Afghanistan | 22.4 /100 | #199 | Fair 17.1% |
| Immigrants | Uzbekistan | 21.5 /100 | #200 | Fair 17.1% |