Assyrian/Chaldean/Syriac vs Guyanese Child Poverty Among Girls Under 16
COMPARE
Assyrian/Chaldean/Syriac
Guyanese
Child Poverty Among Girls Under 16
Child Poverty Among Girls Under 16 Comparison
Assyrians/Chaldeans/Syriacs
Guyanese
13.3%
CHILD POVERTY AMONG GIRLS UNDER 16
99.9/ 100
METRIC RATING
21st/ 347
METRIC RANK
19.4%
CHILD POVERTY AMONG GIRLS UNDER 16
0.2/ 100
METRIC RATING
257th/ 347
METRIC RANK
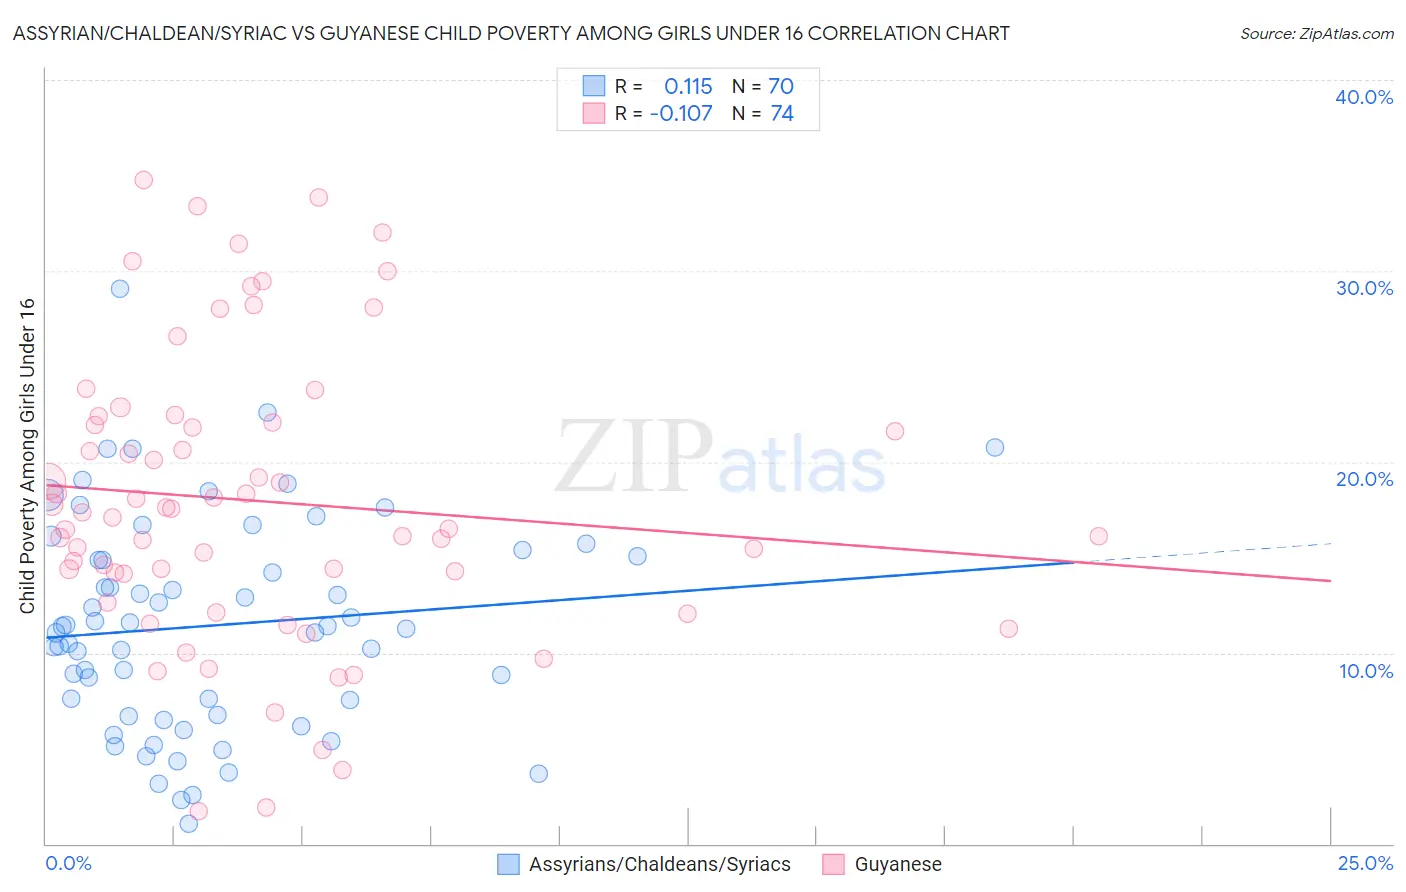
Assyrian/Chaldean/Syriac vs Guyanese Child Poverty Among Girls Under 16 Correlation Chart
The statistical analysis conducted on geographies consisting of 109,412,963 people shows a poor positive correlation between the proportion of Assyrians/Chaldeans/Syriacs and poverty level among girls under the age of 16 in the United States with a correlation coefficient (R) of 0.115 and weighted average of 13.3%. Similarly, the statistical analysis conducted on geographies consisting of 175,189,173 people shows a poor negative correlation between the proportion of Guyanese and poverty level among girls under the age of 16 in the United States with a correlation coefficient (R) of -0.107 and weighted average of 19.4%, a difference of 45.5%.
Child Poverty Among Girls Under 16 Correlation Summary
| Measurement | Assyrian/Chaldean/Syriac | Guyanese |
| Minimum | 1.1% | 1.7% |
| Maximum | 29.1% | 34.8% |
| Range | 28.0% | 33.1% |
| Mean | 11.4% | 18.0% |
| Median | 11.3% | 17.2% |
| Interquartile 25% (IQ1) | 6.8% | 14.1% |
| Interquartile 75% (IQ3) | 15.0% | 22.1% |
| Interquartile Range (IQR) | 8.3% | 8.0% |
| Standard Deviation (Sample) | 5.6% | 7.6% |
| Standard Deviation (Population) | 5.5% | 7.5% |
Similar Demographics by Child Poverty Among Girls Under 16
Demographics Similar to Assyrians/Chaldeans/Syriacs by Child Poverty Among Girls Under 16
In terms of child poverty among girls under 16, the demographic groups most similar to Assyrians/Chaldeans/Syriacs are Immigrants from Japan (13.3%, a difference of 0.12%), Indian (Asian) (13.3%, a difference of 0.20%), Norwegian (13.3%, a difference of 0.37%), Immigrants from Eastern Asia (13.4%, a difference of 0.46%), and Cypriot (13.2%, a difference of 0.78%).
| Demographics | Rating | Rank | Child Poverty Among Girls Under 16 |
| Burmese | 99.9 /100 | #14 | Exceptional 13.0% |
| Okinawans | 99.9 /100 | #15 | Exceptional 13.0% |
| Immigrants | Lithuania | 99.9 /100 | #16 | Exceptional 13.1% |
| Bulgarians | 99.9 /100 | #17 | Exceptional 13.1% |
| Immigrants | Korea | 99.9 /100 | #18 | Exceptional 13.1% |
| Cypriots | 99.9 /100 | #19 | Exceptional 13.2% |
| Immigrants | Japan | 99.9 /100 | #20 | Exceptional 13.3% |
| Assyrians/Chaldeans/Syriacs | 99.9 /100 | #21 | Exceptional 13.3% |
| Indians (Asian) | 99.9 /100 | #22 | Exceptional 13.3% |
| Norwegians | 99.9 /100 | #23 | Exceptional 13.3% |
| Immigrants | Eastern Asia | 99.9 /100 | #24 | Exceptional 13.4% |
| Immigrants | China | 99.8 /100 | #25 | Exceptional 13.4% |
| Eastern Europeans | 99.8 /100 | #26 | Exceptional 13.5% |
| Latvians | 99.8 /100 | #27 | Exceptional 13.5% |
| Tongans | 99.8 /100 | #28 | Exceptional 13.6% |
Demographics Similar to Guyanese by Child Poverty Among Girls Under 16
In terms of child poverty among girls under 16, the demographic groups most similar to Guyanese are Salvadoran (19.4%, a difference of 0.13%), Ottawa (19.4%, a difference of 0.23%), Trinidadian and Tobagonian (19.3%, a difference of 0.25%), Immigrants from Ecuador (19.3%, a difference of 0.31%), and Immigrants from Western Africa (19.3%, a difference of 0.33%).
| Demographics | Rating | Rank | Child Poverty Among Girls Under 16 |
| Cape Verdeans | 0.3 /100 | #250 | Tragic 19.2% |
| Immigrants | Trinidad and Tobago | 0.3 /100 | #251 | Tragic 19.2% |
| Immigrants | Middle Africa | 0.3 /100 | #252 | Tragic 19.2% |
| Immigrants | Guyana | 0.3 /100 | #253 | Tragic 19.3% |
| Immigrants | Western Africa | 0.3 /100 | #254 | Tragic 19.3% |
| Immigrants | Ecuador | 0.3 /100 | #255 | Tragic 19.3% |
| Trinidadians and Tobagonians | 0.2 /100 | #256 | Tragic 19.3% |
| Guyanese | 0.2 /100 | #257 | Tragic 19.4% |
| Salvadorans | 0.2 /100 | #258 | Tragic 19.4% |
| Ottawa | 0.2 /100 | #259 | Tragic 19.4% |
| Mexican American Indians | 0.2 /100 | #260 | Tragic 19.5% |
| Vietnamese | 0.2 /100 | #261 | Tragic 19.5% |
| Chickasaw | 0.1 /100 | #262 | Tragic 19.6% |
| Immigrants | Burma/Myanmar | 0.1 /100 | #263 | Tragic 19.7% |
| Jamaicans | 0.1 /100 | #264 | Tragic 19.7% |