Assyrian/Chaldean/Syriac vs Uruguayan Child Poverty Among Girls Under 16
COMPARE
Assyrian/Chaldean/Syriac
Uruguayan
Child Poverty Among Girls Under 16
Child Poverty Among Girls Under 16 Comparison
Assyrians/Chaldeans/Syriacs
Uruguayans
13.3%
CHILD POVERTY AMONG GIRLS UNDER 16
99.9/ 100
METRIC RATING
21st/ 347
METRIC RANK
16.2%
CHILD POVERTY AMONG GIRLS UNDER 16
64.7/ 100
METRIC RATING
167th/ 347
METRIC RANK
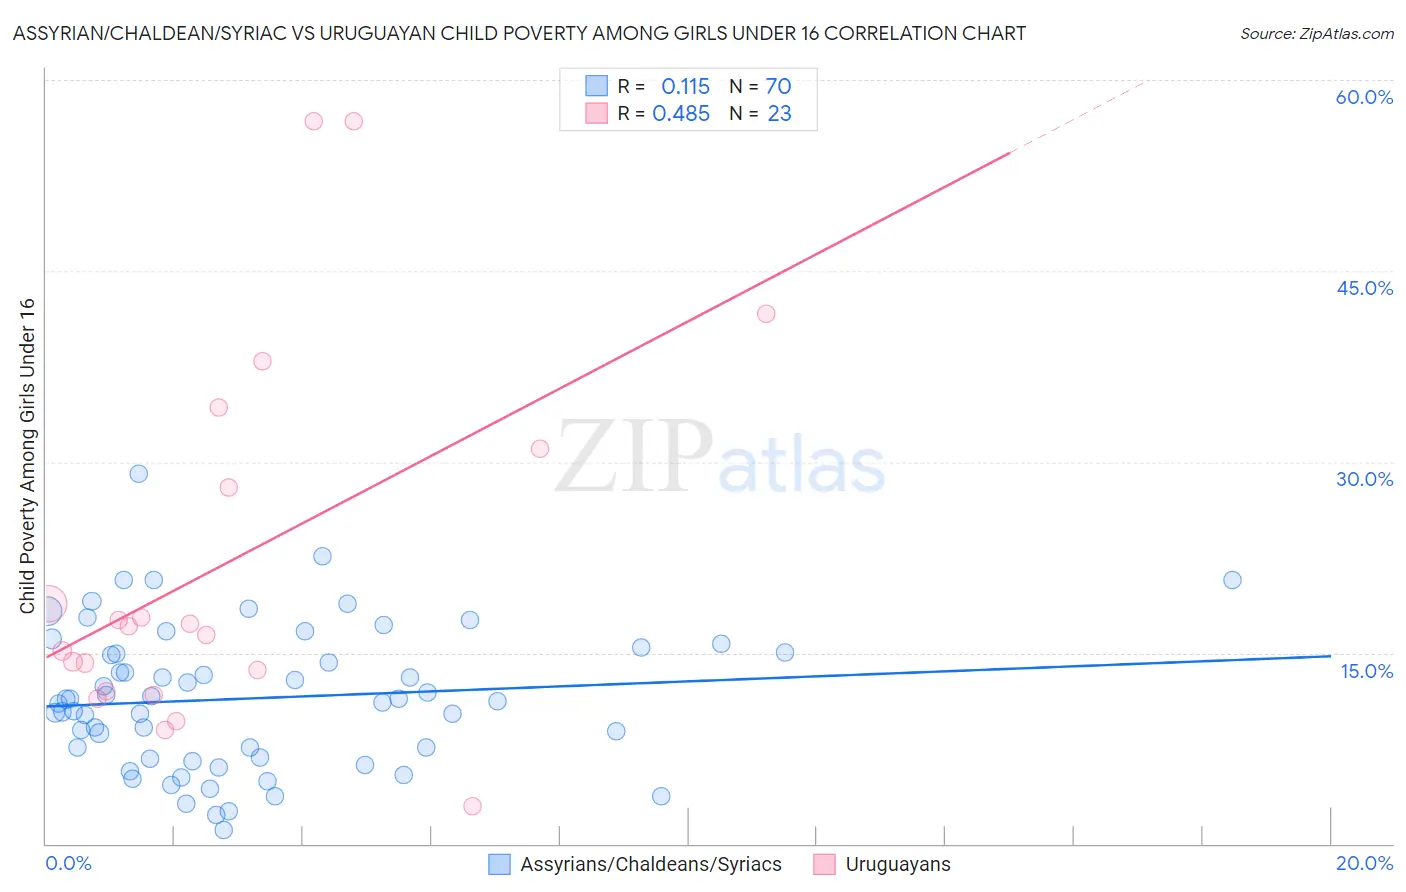
Assyrian/Chaldean/Syriac vs Uruguayan Child Poverty Among Girls Under 16 Correlation Chart
The statistical analysis conducted on geographies consisting of 109,412,963 people shows a poor positive correlation between the proportion of Assyrians/Chaldeans/Syriacs and poverty level among girls under the age of 16 in the United States with a correlation coefficient (R) of 0.115 and weighted average of 13.3%. Similarly, the statistical analysis conducted on geographies consisting of 143,695,709 people shows a moderate positive correlation between the proportion of Uruguayans and poverty level among girls under the age of 16 in the United States with a correlation coefficient (R) of 0.485 and weighted average of 16.2%, a difference of 21.7%.
Child Poverty Among Girls Under 16 Correlation Summary
| Measurement | Assyrian/Chaldean/Syriac | Uruguayan |
| Minimum | 1.1% | 3.0% |
| Maximum | 29.1% | 56.8% |
| Range | 28.0% | 53.8% |
| Mean | 11.4% | 22.0% |
| Median | 11.3% | 17.1% |
| Interquartile 25% (IQ1) | 6.8% | 11.9% |
| Interquartile 75% (IQ3) | 15.0% | 31.0% |
| Interquartile Range (IQR) | 8.3% | 19.1% |
| Standard Deviation (Sample) | 5.6% | 14.6% |
| Standard Deviation (Population) | 5.5% | 14.3% |
Similar Demographics by Child Poverty Among Girls Under 16
Demographics Similar to Assyrians/Chaldeans/Syriacs by Child Poverty Among Girls Under 16
In terms of child poverty among girls under 16, the demographic groups most similar to Assyrians/Chaldeans/Syriacs are Immigrants from Japan (13.3%, a difference of 0.12%), Indian (Asian) (13.3%, a difference of 0.20%), Norwegian (13.3%, a difference of 0.37%), Immigrants from Eastern Asia (13.4%, a difference of 0.46%), and Cypriot (13.2%, a difference of 0.78%).
| Demographics | Rating | Rank | Child Poverty Among Girls Under 16 |
| Burmese | 99.9 /100 | #14 | Exceptional 13.0% |
| Okinawans | 99.9 /100 | #15 | Exceptional 13.0% |
| Immigrants | Lithuania | 99.9 /100 | #16 | Exceptional 13.1% |
| Bulgarians | 99.9 /100 | #17 | Exceptional 13.1% |
| Immigrants | Korea | 99.9 /100 | #18 | Exceptional 13.1% |
| Cypriots | 99.9 /100 | #19 | Exceptional 13.2% |
| Immigrants | Japan | 99.9 /100 | #20 | Exceptional 13.3% |
| Assyrians/Chaldeans/Syriacs | 99.9 /100 | #21 | Exceptional 13.3% |
| Indians (Asian) | 99.9 /100 | #22 | Exceptional 13.3% |
| Norwegians | 99.9 /100 | #23 | Exceptional 13.3% |
| Immigrants | Eastern Asia | 99.9 /100 | #24 | Exceptional 13.4% |
| Immigrants | China | 99.8 /100 | #25 | Exceptional 13.4% |
| Eastern Europeans | 99.8 /100 | #26 | Exceptional 13.5% |
| Latvians | 99.8 /100 | #27 | Exceptional 13.5% |
| Tongans | 99.8 /100 | #28 | Exceptional 13.6% |
Demographics Similar to Uruguayans by Child Poverty Among Girls Under 16
In terms of child poverty among girls under 16, the demographic groups most similar to Uruguayans are Yugoslavian (16.2%, a difference of 0.040%), Costa Rican (16.2%, a difference of 0.060%), Immigrants from Venezuela (16.2%, a difference of 0.060%), Immigrants from Saudi Arabia (16.2%, a difference of 0.090%), and Afghan (16.2%, a difference of 0.30%).
| Demographics | Rating | Rank | Child Poverty Among Girls Under 16 |
| French | 72.8 /100 | #160 | Good 16.0% |
| Immigrants | Northern Africa | 72.0 /100 | #161 | Good 16.0% |
| French Canadians | 68.7 /100 | #162 | Good 16.1% |
| Immigrants | Oceania | 68.4 /100 | #163 | Good 16.1% |
| Immigrants | Colombia | 67.8 /100 | #164 | Good 16.1% |
| Immigrants | Germany | 67.3 /100 | #165 | Good 16.1% |
| South Americans | 67.2 /100 | #166 | Good 16.1% |
| Uruguayans | 64.7 /100 | #167 | Good 16.2% |
| Yugoslavians | 64.4 /100 | #168 | Good 16.2% |
| Costa Ricans | 64.2 /100 | #169 | Good 16.2% |
| Immigrants | Venezuela | 64.2 /100 | #170 | Good 16.2% |
| Immigrants | Saudi Arabia | 64.0 /100 | #171 | Good 16.2% |
| Afghans | 62.3 /100 | #172 | Good 16.2% |
| Immigrants | South America | 55.1 /100 | #173 | Average 16.4% |
| Ethiopians | 50.0 /100 | #174 | Average 16.5% |