Assyrian/Chaldean/Syriac vs Yup'ik Child Poverty Among Girls Under 16
COMPARE
Assyrian/Chaldean/Syriac
Yup'ik
Child Poverty Among Girls Under 16
Child Poverty Among Girls Under 16 Comparison
Assyrians/Chaldeans/Syriacs
Yup'ik
13.3%
CHILD POVERTY AMONG GIRLS UNDER 16
99.9/ 100
METRIC RATING
21st/ 347
METRIC RANK
25.8%
CHILD POVERTY AMONG GIRLS UNDER 16
0.0/ 100
METRIC RATING
337th/ 347
METRIC RANK
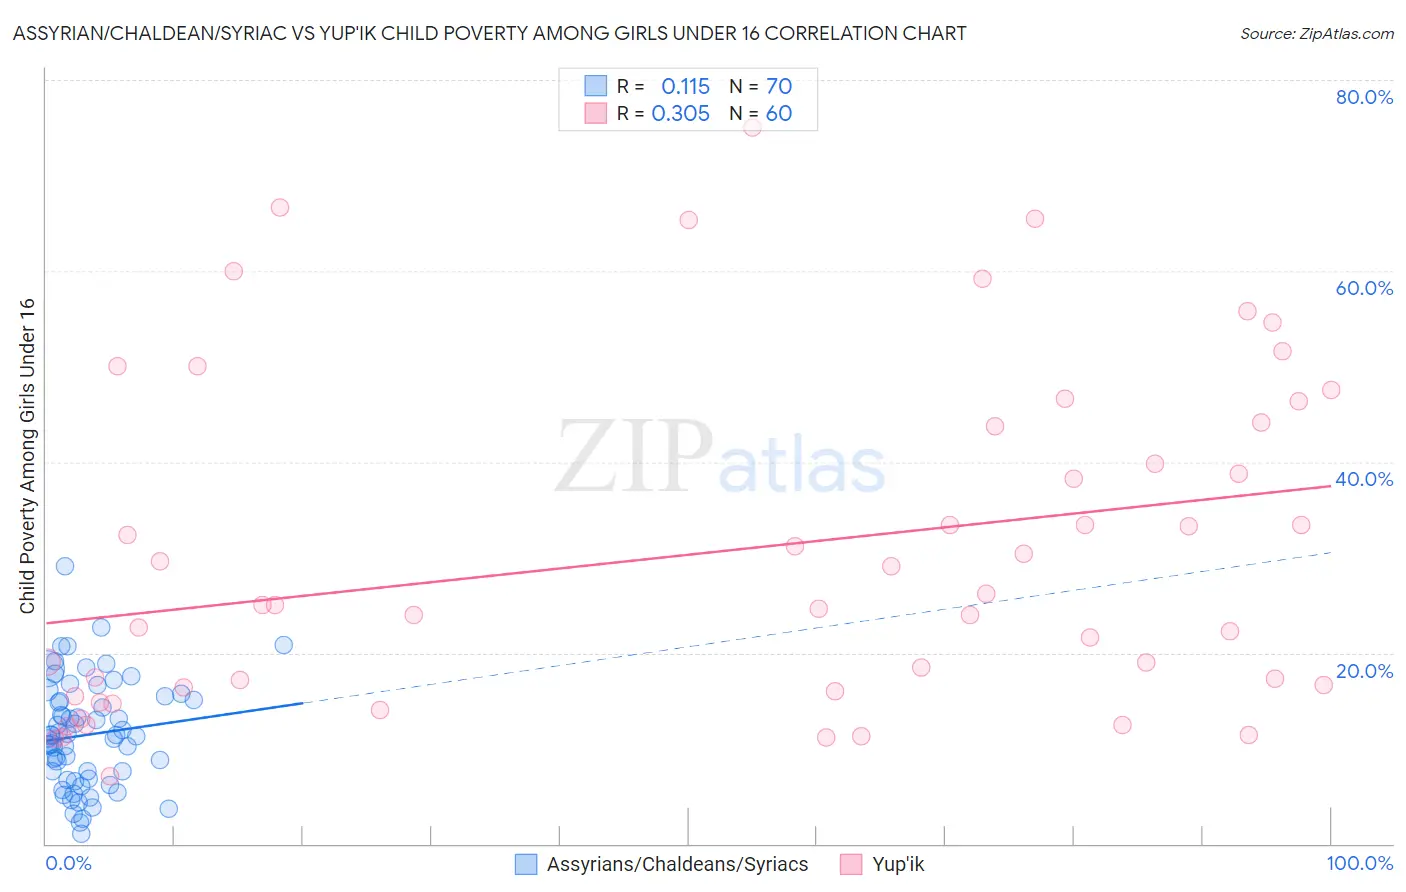
Assyrian/Chaldean/Syriac vs Yup'ik Child Poverty Among Girls Under 16 Correlation Chart
The statistical analysis conducted on geographies consisting of 109,412,963 people shows a poor positive correlation between the proportion of Assyrians/Chaldeans/Syriacs and poverty level among girls under the age of 16 in the United States with a correlation coefficient (R) of 0.115 and weighted average of 13.3%. Similarly, the statistical analysis conducted on geographies consisting of 39,851,220 people shows a mild positive correlation between the proportion of Yup'ik and poverty level among girls under the age of 16 in the United States with a correlation coefficient (R) of 0.305 and weighted average of 25.8%, a difference of 94.1%.
Child Poverty Among Girls Under 16 Correlation Summary
| Measurement | Assyrian/Chaldean/Syriac | Yup'ik |
| Minimum | 1.1% | 7.1% |
| Maximum | 29.1% | 75.0% |
| Range | 28.0% | 67.9% |
| Mean | 11.4% | 30.5% |
| Median | 11.3% | 25.0% |
| Interquartile 25% (IQ1) | 6.8% | 16.1% |
| Interquartile 75% (IQ3) | 15.0% | 43.9% |
| Interquartile Range (IQR) | 8.3% | 27.8% |
| Standard Deviation (Sample) | 5.6% | 17.4% |
| Standard Deviation (Population) | 5.5% | 17.3% |
Similar Demographics by Child Poverty Among Girls Under 16
Demographics Similar to Assyrians/Chaldeans/Syriacs by Child Poverty Among Girls Under 16
In terms of child poverty among girls under 16, the demographic groups most similar to Assyrians/Chaldeans/Syriacs are Immigrants from Japan (13.3%, a difference of 0.12%), Indian (Asian) (13.3%, a difference of 0.20%), Norwegian (13.3%, a difference of 0.37%), Immigrants from Eastern Asia (13.4%, a difference of 0.46%), and Cypriot (13.2%, a difference of 0.78%).
| Demographics | Rating | Rank | Child Poverty Among Girls Under 16 |
| Burmese | 99.9 /100 | #14 | Exceptional 13.0% |
| Okinawans | 99.9 /100 | #15 | Exceptional 13.0% |
| Immigrants | Lithuania | 99.9 /100 | #16 | Exceptional 13.1% |
| Bulgarians | 99.9 /100 | #17 | Exceptional 13.1% |
| Immigrants | Korea | 99.9 /100 | #18 | Exceptional 13.1% |
| Cypriots | 99.9 /100 | #19 | Exceptional 13.2% |
| Immigrants | Japan | 99.9 /100 | #20 | Exceptional 13.3% |
| Assyrians/Chaldeans/Syriacs | 99.9 /100 | #21 | Exceptional 13.3% |
| Indians (Asian) | 99.9 /100 | #22 | Exceptional 13.3% |
| Norwegians | 99.9 /100 | #23 | Exceptional 13.3% |
| Immigrants | Eastern Asia | 99.9 /100 | #24 | Exceptional 13.4% |
| Immigrants | China | 99.8 /100 | #25 | Exceptional 13.4% |
| Eastern Europeans | 99.8 /100 | #26 | Exceptional 13.5% |
| Latvians | 99.8 /100 | #27 | Exceptional 13.5% |
| Tongans | 99.8 /100 | #28 | Exceptional 13.6% |
Demographics Similar to Yup'ik by Child Poverty Among Girls Under 16
In terms of child poverty among girls under 16, the demographic groups most similar to Yup'ik are Sioux (25.6%, a difference of 0.93%), Cheyenne (26.3%, a difference of 1.8%), Crow (26.4%, a difference of 2.1%), Pueblo (25.2%, a difference of 2.4%), and Menominee (25.0%, a difference of 3.1%).
| Demographics | Rating | Rank | Child Poverty Among Girls Under 16 |
| Immigrants | Dominican Republic | 0.0 /100 | #330 | Tragic 23.8% |
| Apache | 0.0 /100 | #331 | Tragic 23.8% |
| Natives/Alaskans | 0.0 /100 | #332 | Tragic 24.0% |
| Blacks/African Americans | 0.0 /100 | #333 | Tragic 24.7% |
| Menominee | 0.0 /100 | #334 | Tragic 25.0% |
| Pueblo | 0.0 /100 | #335 | Tragic 25.2% |
| Sioux | 0.0 /100 | #336 | Tragic 25.6% |
| Yup'ik | 0.0 /100 | #337 | Tragic 25.8% |
| Cheyenne | 0.0 /100 | #338 | Tragic 26.3% |
| Crow | 0.0 /100 | #339 | Tragic 26.4% |
| Yuman | 0.0 /100 | #340 | Tragic 27.1% |
| Hopi | 0.0 /100 | #341 | Tragic 27.9% |
| Pima | 0.0 /100 | #342 | Tragic 28.2% |
| Immigrants | Yemen | 0.0 /100 | #343 | Tragic 29.5% |
| Navajo | 0.0 /100 | #344 | Tragic 30.5% |