Assyrian/Chaldean/Syriac vs Pakistani Unemployment Among Ages 20 to 24 years
COMPARE
Assyrian/Chaldean/Syriac
Pakistani
Unemployment Among Ages 20 to 24 years
Unemployment Among Ages 20 to 24 years Comparison
Assyrians/Chaldeans/Syriacs
Pakistanis
9.9%
UNEMPLOYMENT AMONG AGES 20 TO 24 YEARS
98.3/ 100
METRIC RATING
78th/ 347
METRIC RANK
9.8%
UNEMPLOYMENT AMONG AGES 20 TO 24 YEARS
99.5/ 100
METRIC RATING
58th/ 347
METRIC RANK
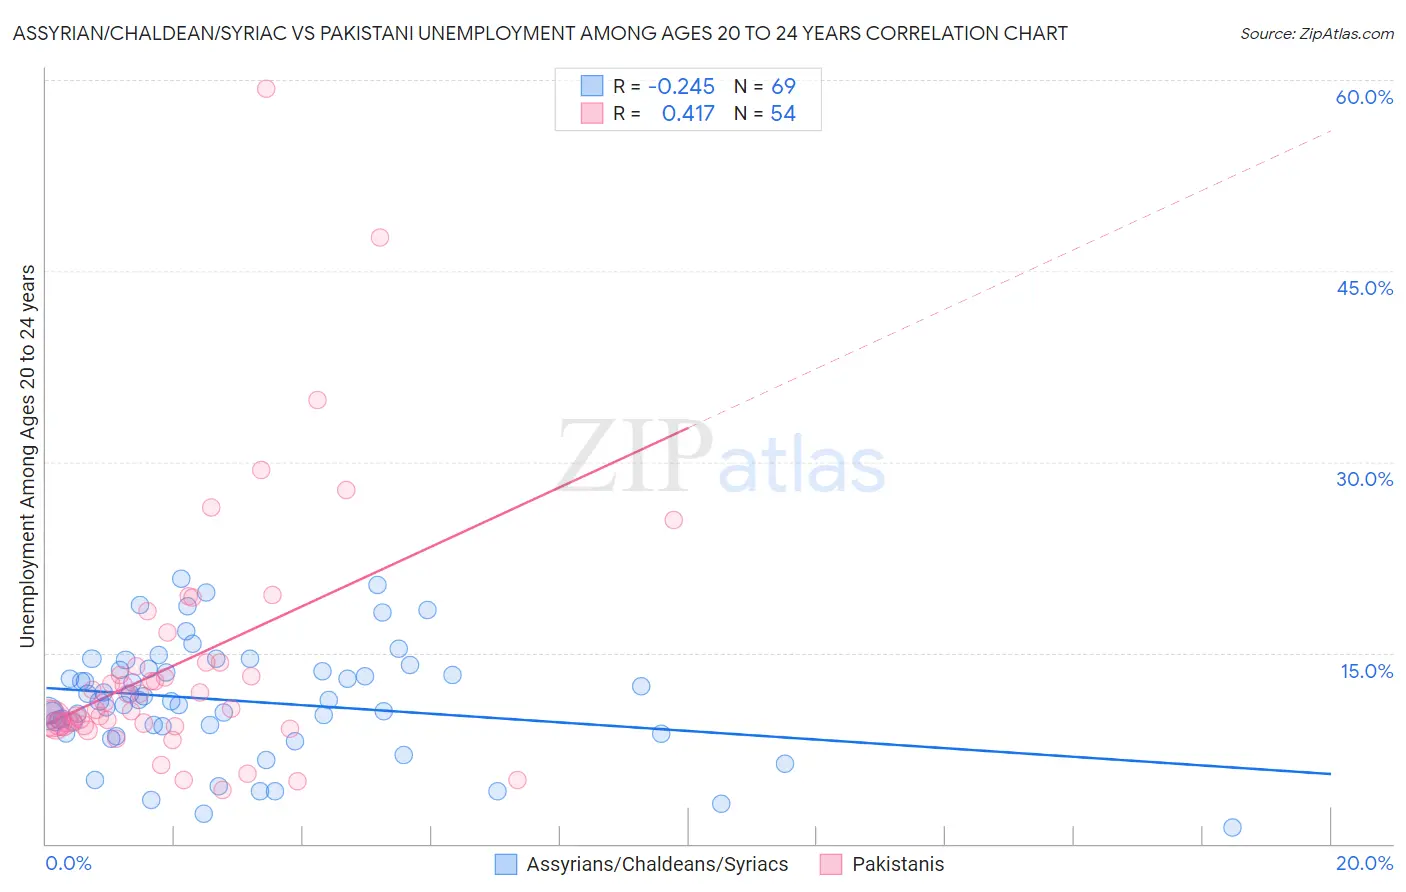
Assyrian/Chaldean/Syriac vs Pakistani Unemployment Among Ages 20 to 24 years Correlation Chart
The statistical analysis conducted on geographies consisting of 109,491,073 people shows a weak negative correlation between the proportion of Assyrians/Chaldeans/Syriacs and unemployment rate among population between the ages 20 and 24 in the United States with a correlation coefficient (R) of -0.245 and weighted average of 9.9%. Similarly, the statistical analysis conducted on geographies consisting of 328,618,877 people shows a moderate positive correlation between the proportion of Pakistanis and unemployment rate among population between the ages 20 and 24 in the United States with a correlation coefficient (R) of 0.417 and weighted average of 9.8%, a difference of 1.1%.
Unemployment Among Ages 20 to 24 years Correlation Summary
| Measurement | Assyrian/Chaldean/Syriac | Pakistani |
| Minimum | 1.3% | 4.2% |
| Maximum | 20.8% | 59.3% |
| Range | 19.5% | 55.1% |
| Mean | 11.2% | 14.2% |
| Median | 11.2% | 10.8% |
| Interquartile 25% (IQ1) | 8.9% | 9.3% |
| Interquartile 75% (IQ3) | 13.7% | 14.2% |
| Interquartile Range (IQR) | 4.8% | 4.9% |
| Standard Deviation (Sample) | 4.4% | 10.1% |
| Standard Deviation (Population) | 4.3% | 10.0% |
Demographics Similar to Assyrians/Chaldeans/Syriacs and Pakistanis by Unemployment Among Ages 20 to 24 years
In terms of unemployment among ages 20 to 24 years, the demographic groups most similar to Assyrians/Chaldeans/Syriacs are Chickasaw (9.9%, a difference of 0.030%), Czechoslovakian (9.9%, a difference of 0.050%), Immigrants from Australia (9.9%, a difference of 0.14%), Immigrants from Laos (9.9%, a difference of 0.21%), and Kenyan (9.9%, a difference of 0.24%). Similarly, the demographic groups most similar to Pakistanis are English (9.8%, a difference of 0.0%), Immigrants from Kuwait (9.8%, a difference of 0.030%), Malaysian (9.8%, a difference of 0.050%), Immigrants from Singapore (9.8%, a difference of 0.15%), and British (9.8%, a difference of 0.16%).
| Demographics | Rating | Rank | Unemployment Among Ages 20 to 24 years |
| Pakistanis | 99.5 /100 | #58 | Exceptional 9.8% |
| English | 99.5 /100 | #59 | Exceptional 9.8% |
| Immigrants | Kuwait | 99.5 /100 | #60 | Exceptional 9.8% |
| Malaysians | 99.5 /100 | #61 | Exceptional 9.8% |
| Immigrants | Singapore | 99.4 /100 | #62 | Exceptional 9.8% |
| British | 99.4 /100 | #63 | Exceptional 9.8% |
| Serbians | 99.4 /100 | #64 | Exceptional 9.8% |
| Welsh | 99.3 /100 | #65 | Exceptional 9.8% |
| Scottish | 99.3 /100 | #66 | Exceptional 9.8% |
| Immigrants | Bolivia | 99.2 /100 | #67 | Exceptional 9.9% |
| Mongolians | 99.1 /100 | #68 | Exceptional 9.9% |
| Bulgarians | 99.1 /100 | #69 | Exceptional 9.9% |
| Immigrants | Croatia | 99.0 /100 | #70 | Exceptional 9.9% |
| Celtics | 98.9 /100 | #71 | Exceptional 9.9% |
| Bolivians | 98.9 /100 | #72 | Exceptional 9.9% |
| Kenyans | 98.7 /100 | #73 | Exceptional 9.9% |
| Immigrants | Laos | 98.7 /100 | #74 | Exceptional 9.9% |
| Immigrants | Australia | 98.6 /100 | #75 | Exceptional 9.9% |
| Czechoslovakians | 98.4 /100 | #76 | Exceptional 9.9% |
| Chickasaw | 98.4 /100 | #77 | Exceptional 9.9% |
| Assyrians/Chaldeans/Syriacs | 98.3 /100 | #78 | Exceptional 9.9% |