Immigrants from South Eastern Asia vs Yugoslavian Single Female Poverty
COMPARE
Immigrants from South Eastern Asia
Yugoslavian
Single Female Poverty
Single Female Poverty Comparison
Immigrants from South Eastern Asia
Yugoslavians
19.3%
SINGLE FEMALE POVERTY
99.4/ 100
METRIC RATING
71st/ 347
METRIC RANK
21.2%
SINGLE FEMALE POVERTY
35.4/ 100
METRIC RATING
188th/ 347
METRIC RANK
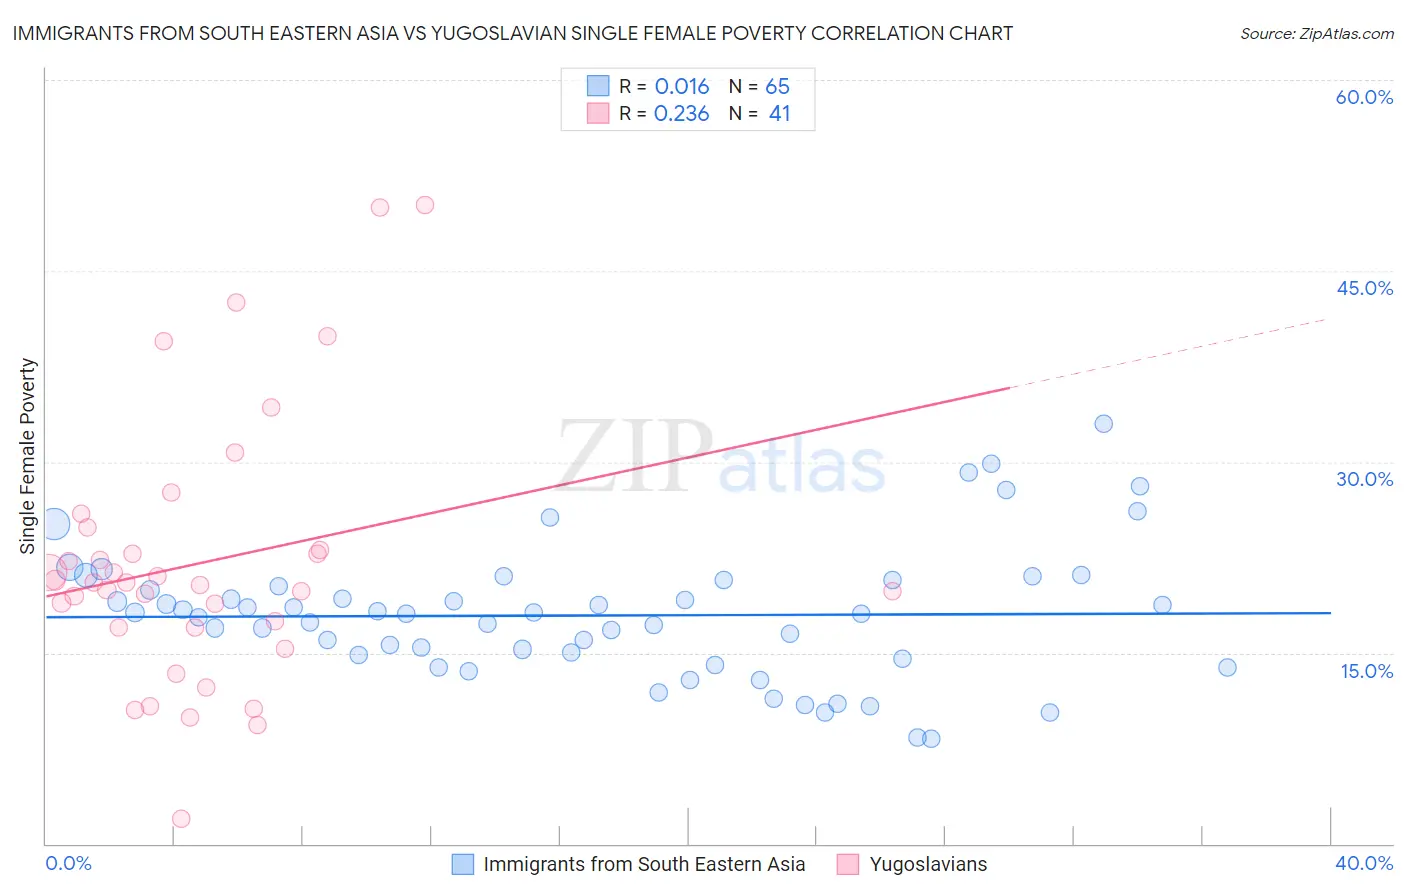
Immigrants from South Eastern Asia vs Yugoslavian Single Female Poverty Correlation Chart
The statistical analysis conducted on geographies consisting of 500,482,626 people shows no correlation between the proportion of Immigrants from South Eastern Asia and poverty level among single females in the United States with a correlation coefficient (R) of 0.016 and weighted average of 19.3%. Similarly, the statistical analysis conducted on geographies consisting of 282,795,313 people shows a weak positive correlation between the proportion of Yugoslavians and poverty level among single females in the United States with a correlation coefficient (R) of 0.236 and weighted average of 21.2%, a difference of 9.7%.
Single Female Poverty Correlation Summary
| Measurement | Immigrants from South Eastern Asia | Yugoslavian |
| Minimum | 8.3% | 2.0% |
| Maximum | 33.0% | 50.2% |
| Range | 24.7% | 48.2% |
| Mean | 17.9% | 22.1% |
| Median | 18.0% | 20.5% |
| Interquartile 25% (IQ1) | 14.7% | 17.0% |
| Interquartile 75% (IQ3) | 20.4% | 23.9% |
| Interquartile Range (IQR) | 5.8% | 7.0% |
| Standard Deviation (Sample) | 5.1% | 10.4% |
| Standard Deviation (Population) | 5.1% | 10.3% |
Similar Demographics by Single Female Poverty
Demographics Similar to Immigrants from South Eastern Asia by Single Female Poverty
In terms of single female poverty, the demographic groups most similar to Immigrants from South Eastern Asia are Immigrants from Latvia (19.3%, a difference of 0.0%), Immigrants from Jordan (19.3%, a difference of 0.070%), Immigrants from Peru (19.3%, a difference of 0.10%), Immigrants from Belarus (19.3%, a difference of 0.12%), and Paraguayan (19.3%, a difference of 0.13%).
| Demographics | Rating | Rank | Single Female Poverty |
| Immigrants | Europe | 99.6 /100 | #64 | Exceptional 19.2% |
| Cypriots | 99.6 /100 | #65 | Exceptional 19.2% |
| Palestinians | 99.6 /100 | #66 | Exceptional 19.2% |
| Immigrants | Egypt | 99.6 /100 | #67 | Exceptional 19.2% |
| Laotians | 99.5 /100 | #68 | Exceptional 19.3% |
| Paraguayans | 99.5 /100 | #69 | Exceptional 19.3% |
| Immigrants | Jordan | 99.4 /100 | #70 | Exceptional 19.3% |
| Immigrants | South Eastern Asia | 99.4 /100 | #71 | Exceptional 19.3% |
| Immigrants | Latvia | 99.4 /100 | #72 | Exceptional 19.3% |
| Immigrants | Peru | 99.4 /100 | #73 | Exceptional 19.3% |
| Immigrants | Belarus | 99.4 /100 | #74 | Exceptional 19.3% |
| Immigrants | Turkey | 99.4 /100 | #75 | Exceptional 19.4% |
| Peruvians | 99.4 /100 | #76 | Exceptional 19.4% |
| Immigrants | Russia | 99.3 /100 | #77 | Exceptional 19.4% |
| Albanians | 99.3 /100 | #78 | Exceptional 19.4% |
Demographics Similar to Yugoslavians by Single Female Poverty
In terms of single female poverty, the demographic groups most similar to Yugoslavians are Immigrants from Cuba (21.2%, a difference of 0.010%), Trinidadian and Tobagonian (21.2%, a difference of 0.010%), Immigrants from Nigeria (21.2%, a difference of 0.090%), Hawaiian (21.2%, a difference of 0.15%), and Immigrants from Cambodia (21.2%, a difference of 0.19%).
| Demographics | Rating | Rank | Single Female Poverty |
| Europeans | 42.3 /100 | #181 | Average 21.1% |
| Slavs | 40.5 /100 | #182 | Average 21.1% |
| Slovaks | 39.7 /100 | #183 | Fair 21.1% |
| Hungarians | 39.6 /100 | #184 | Fair 21.1% |
| Immigrants | Cambodia | 38.2 /100 | #185 | Fair 21.2% |
| Hawaiians | 37.7 /100 | #186 | Fair 21.2% |
| Immigrants | Nigeria | 36.8 /100 | #187 | Fair 21.2% |
| Yugoslavians | 35.4 /100 | #188 | Fair 21.2% |
| Immigrants | Cuba | 35.3 /100 | #189 | Fair 21.2% |
| Trinidadians and Tobagonians | 35.2 /100 | #190 | Fair 21.2% |
| Immigrants | Germany | 31.1 /100 | #191 | Fair 21.3% |
| Immigrants | Jamaica | 30.5 /100 | #192 | Fair 21.3% |
| Basques | 28.1 /100 | #193 | Fair 21.3% |
| Czechoslovakians | 27.7 /100 | #194 | Fair 21.3% |
| Nicaraguans | 27.6 /100 | #195 | Fair 21.3% |