Immigrants from Germany vs Yugoslavian Single Female Poverty
COMPARE
Immigrants from Germany
Yugoslavian
Single Female Poverty
Single Female Poverty Comparison
Immigrants from Germany
Yugoslavians
21.3%
SINGLE FEMALE POVERTY
31.1/ 100
METRIC RATING
191st/ 347
METRIC RANK
21.2%
SINGLE FEMALE POVERTY
35.4/ 100
METRIC RATING
188th/ 347
METRIC RANK
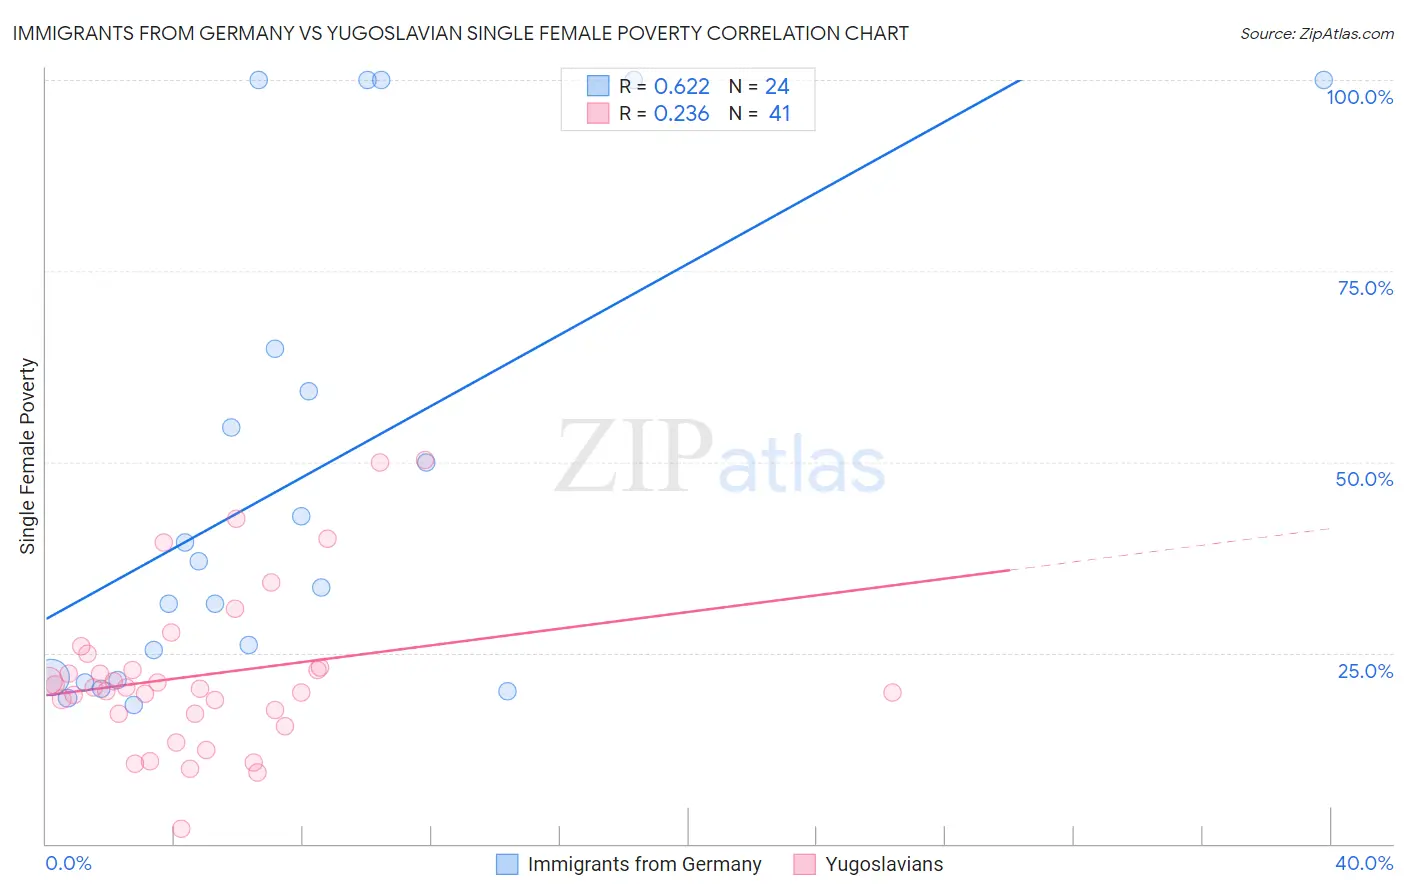
Immigrants from Germany vs Yugoslavian Single Female Poverty Correlation Chart
The statistical analysis conducted on geographies consisting of 454,450,441 people shows a significant positive correlation between the proportion of Immigrants from Germany and poverty level among single females in the United States with a correlation coefficient (R) of 0.622 and weighted average of 21.3%. Similarly, the statistical analysis conducted on geographies consisting of 282,795,313 people shows a weak positive correlation between the proportion of Yugoslavians and poverty level among single females in the United States with a correlation coefficient (R) of 0.236 and weighted average of 21.2%, a difference of 0.30%.
Single Female Poverty Correlation Summary
| Measurement | Immigrants from Germany | Yugoslavian |
| Minimum | 18.2% | 2.0% |
| Maximum | 100.0% | 50.2% |
| Range | 81.8% | 48.2% |
| Mean | 47.4% | 22.1% |
| Median | 35.2% | 20.5% |
| Interquartile 25% (IQ1) | 21.6% | 17.0% |
| Interquartile 75% (IQ3) | 62.1% | 23.9% |
| Interquartile Range (IQR) | 40.4% | 7.0% |
| Standard Deviation (Sample) | 30.5% | 10.4% |
| Standard Deviation (Population) | 29.8% | 10.3% |
Demographics Similar to Immigrants from Germany and Yugoslavians by Single Female Poverty
In terms of single female poverty, the demographic groups most similar to Immigrants from Germany are Immigrants from Jamaica (21.3%, a difference of 0.040%), Basque (21.3%, a difference of 0.22%), Czechoslovakian (21.3%, a difference of 0.25%), Nicaraguan (21.3%, a difference of 0.26%), and Immigrants from Cuba (21.2%, a difference of 0.29%). Similarly, the demographic groups most similar to Yugoslavians are Immigrants from Cuba (21.2%, a difference of 0.010%), Trinidadian and Tobagonian (21.2%, a difference of 0.010%), Immigrants from Nigeria (21.2%, a difference of 0.090%), Hawaiian (21.2%, a difference of 0.15%), and Immigrants from Cambodia (21.2%, a difference of 0.19%).
| Demographics | Rating | Rank | Single Female Poverty |
| British | 42.9 /100 | #179 | Average 21.1% |
| Spanish American Indians | 42.5 /100 | #180 | Average 21.1% |
| Europeans | 42.3 /100 | #181 | Average 21.1% |
| Slavs | 40.5 /100 | #182 | Average 21.1% |
| Slovaks | 39.7 /100 | #183 | Fair 21.1% |
| Hungarians | 39.6 /100 | #184 | Fair 21.1% |
| Immigrants | Cambodia | 38.2 /100 | #185 | Fair 21.2% |
| Hawaiians | 37.7 /100 | #186 | Fair 21.2% |
| Immigrants | Nigeria | 36.8 /100 | #187 | Fair 21.2% |
| Yugoslavians | 35.4 /100 | #188 | Fair 21.2% |
| Immigrants | Cuba | 35.3 /100 | #189 | Fair 21.2% |
| Trinidadians and Tobagonians | 35.2 /100 | #190 | Fair 21.2% |
| Immigrants | Germany | 31.1 /100 | #191 | Fair 21.3% |
| Immigrants | Jamaica | 30.5 /100 | #192 | Fair 21.3% |
| Basques | 28.1 /100 | #193 | Fair 21.3% |
| Czechoslovakians | 27.7 /100 | #194 | Fair 21.3% |
| Nicaraguans | 27.6 /100 | #195 | Fair 21.3% |
| Immigrants | Saudi Arabia | 27.1 /100 | #196 | Fair 21.3% |
| Japanese | 26.4 /100 | #197 | Fair 21.3% |
| Swiss | 24.2 /100 | #198 | Fair 21.4% |
| Immigrants | Immigrants | 22.0 /100 | #199 | Fair 21.4% |