Asian vs Yugoslavian College, 1 year or more
COMPARE
Asian
Yugoslavian
College, 1 year or more
College, 1 year or more Comparison
Asians
Yugoslavians
64.2%
COLLEGE, 1 YEAR OR MORE
99.8/ 100
METRIC RATING
53rd/ 347
METRIC RANK
59.2%
COLLEGE, 1 YEAR OR MORE
44.1/ 100
METRIC RATING
180th/ 347
METRIC RANK
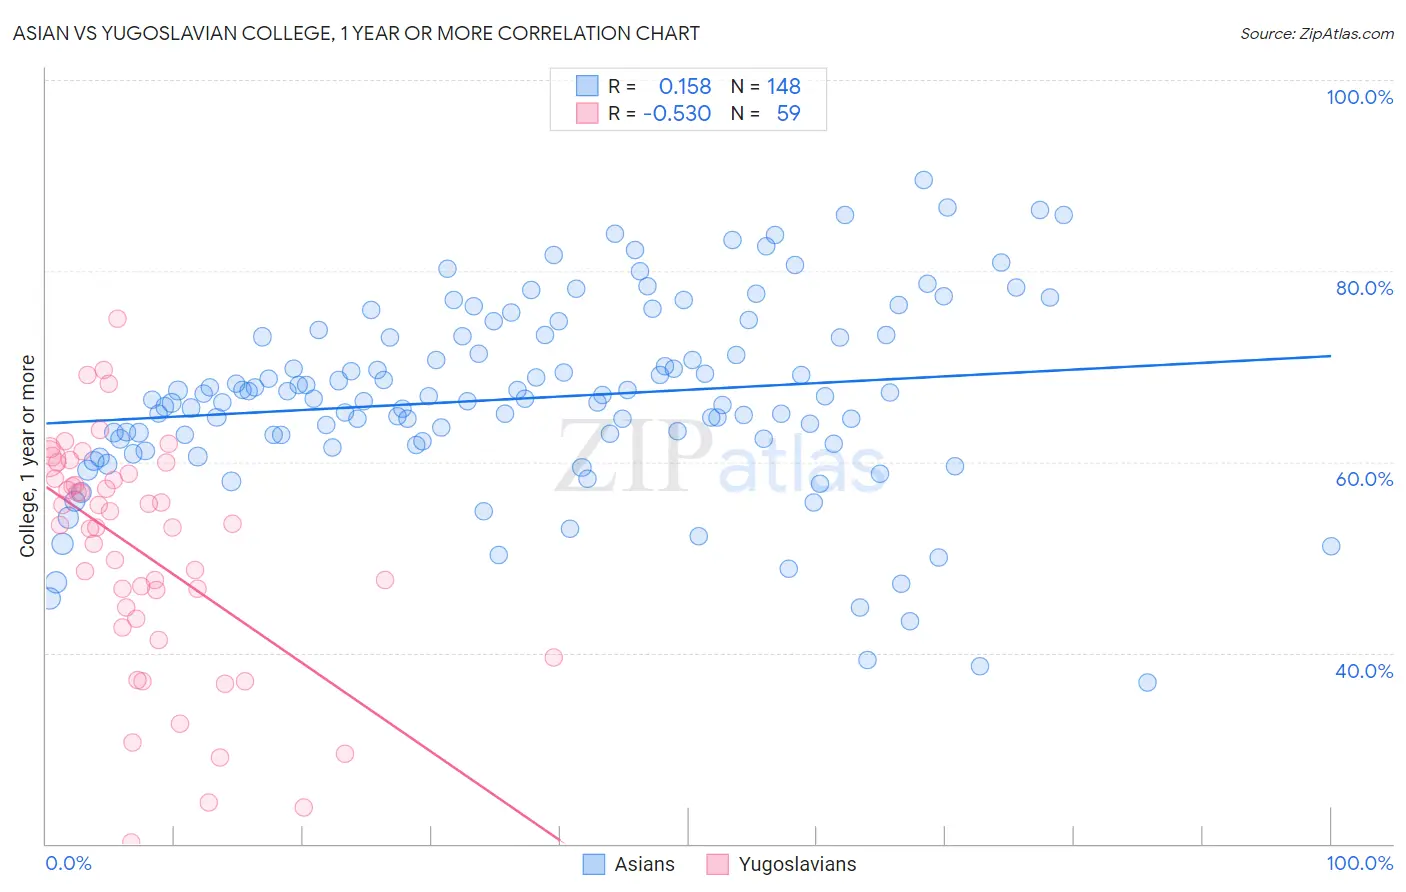
Asian vs Yugoslavian College, 1 year or more Correlation Chart
The statistical analysis conducted on geographies consisting of 550,911,104 people shows a poor positive correlation between the proportion of Asians and percentage of population with at least college, 1 year or more education in the United States with a correlation coefficient (R) of 0.158 and weighted average of 64.2%. Similarly, the statistical analysis conducted on geographies consisting of 285,723,201 people shows a substantial negative correlation between the proportion of Yugoslavians and percentage of population with at least college, 1 year or more education in the United States with a correlation coefficient (R) of -0.530 and weighted average of 59.2%, a difference of 8.4%.
College, 1 year or more Correlation Summary
| Measurement | Asian | Yugoslavian |
| Minimum | 36.8% | 20.1% |
| Maximum | 89.5% | 75.0% |
| Range | 52.7% | 54.9% |
| Mean | 66.7% | 50.6% |
| Median | 66.6% | 53.3% |
| Interquartile 25% (IQ1) | 62.3% | 43.6% |
| Interquartile 75% (IQ3) | 73.1% | 58.8% |
| Interquartile Range (IQR) | 10.9% | 15.2% |
| Standard Deviation (Sample) | 10.0% | 12.1% |
| Standard Deviation (Population) | 10.0% | 12.0% |
Similar Demographics by College, 1 year or more
Demographics Similar to Asians by College, 1 year or more
In terms of college, 1 year or more, the demographic groups most similar to Asians are Immigrants from Netherlands (64.2%, a difference of 0.020%), Zimbabwean (64.2%, a difference of 0.030%), Immigrants from Belarus (64.1%, a difference of 0.15%), Immigrants from Czechoslovakia (64.1%, a difference of 0.17%), and Immigrants from Malaysia (64.3%, a difference of 0.18%).
| Demographics | Rating | Rank | College, 1 year or more |
| Bhutanese | 99.9 /100 | #46 | Exceptional 64.6% |
| Australians | 99.9 /100 | #47 | Exceptional 64.6% |
| Immigrants | Bulgaria | 99.9 /100 | #48 | Exceptional 64.6% |
| New Zealanders | 99.9 /100 | #49 | Exceptional 64.6% |
| Immigrants | Austria | 99.8 /100 | #50 | Exceptional 64.4% |
| Immigrants | Malaysia | 99.8 /100 | #51 | Exceptional 64.3% |
| Immigrants | Netherlands | 99.8 /100 | #52 | Exceptional 64.2% |
| Asians | 99.8 /100 | #53 | Exceptional 64.2% |
| Zimbabweans | 99.8 /100 | #54 | Exceptional 64.2% |
| Immigrants | Belarus | 99.7 /100 | #55 | Exceptional 64.1% |
| Immigrants | Czechoslovakia | 99.7 /100 | #56 | Exceptional 64.1% |
| South Africans | 99.7 /100 | #57 | Exceptional 64.1% |
| Immigrants | Asia | 99.7 /100 | #58 | Exceptional 64.0% |
| Immigrants | Serbia | 99.6 /100 | #59 | Exceptional 63.8% |
| Immigrants | Kazakhstan | 99.5 /100 | #60 | Exceptional 63.6% |
Demographics Similar to Yugoslavians by College, 1 year or more
In terms of college, 1 year or more, the demographic groups most similar to Yugoslavians are Swiss (59.2%, a difference of 0.040%), Immigrants from Bosnia and Herzegovina (59.2%, a difference of 0.070%), Bermudan (59.3%, a difference of 0.14%), Tlingit-Haida (59.4%, a difference of 0.23%), and Czechoslovakian (59.4%, a difference of 0.23%).
| Demographics | Rating | Rank | College, 1 year or more |
| Immigrants | Oceania | 51.2 /100 | #173 | Average 59.4% |
| Celtics | 50.0 /100 | #174 | Average 59.4% |
| Sri Lankans | 49.0 /100 | #175 | Average 59.4% |
| Immigrants | Poland | 48.9 /100 | #176 | Average 59.4% |
| Tlingit-Haida | 48.4 /100 | #177 | Average 59.4% |
| Czechoslovakians | 48.3 /100 | #178 | Average 59.4% |
| Bermudans | 46.6 /100 | #179 | Average 59.3% |
| Yugoslavians | 44.1 /100 | #180 | Average 59.2% |
| Swiss | 43.4 /100 | #181 | Average 59.2% |
| Immigrants | Bosnia and Herzegovina | 42.8 /100 | #182 | Average 59.2% |
| German Russians | 39.3 /100 | #183 | Fair 59.1% |
| Spaniards | 38.3 /100 | #184 | Fair 59.0% |
| South Americans | 35.9 /100 | #185 | Fair 59.0% |
| Scotch-Irish | 34.7 /100 | #186 | Fair 58.9% |
| Germans | 34.7 /100 | #187 | Fair 58.9% |