Lebanese vs Immigrants from India Single Female Poverty
COMPARE
Lebanese
Immigrants from India
Single Female Poverty
Single Female Poverty Comparison
Lebanese
Immigrants from India
20.8%
SINGLE FEMALE POVERTY
67.6/ 100
METRIC RATING
163rd/ 347
METRIC RANK
16.8%
SINGLE FEMALE POVERTY
100.0/ 100
METRIC RATING
4th/ 347
METRIC RANK
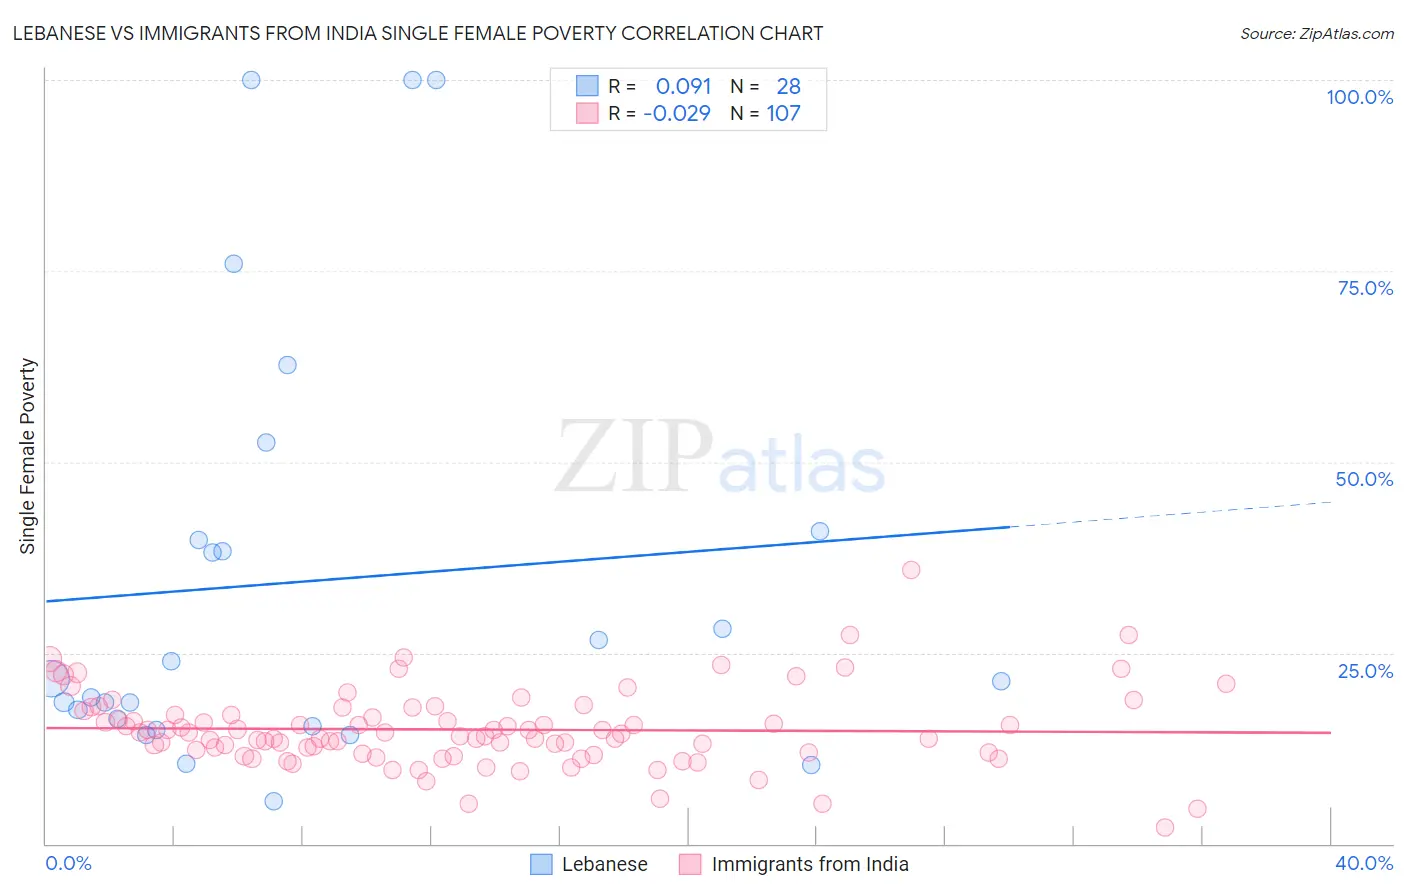
Lebanese vs Immigrants from India Single Female Poverty Correlation Chart
The statistical analysis conducted on geographies consisting of 394,403,389 people shows a slight positive correlation between the proportion of Lebanese and poverty level among single females in the United States with a correlation coefficient (R) of 0.091 and weighted average of 20.8%. Similarly, the statistical analysis conducted on geographies consisting of 425,520,068 people shows no correlation between the proportion of Immigrants from India and poverty level among single females in the United States with a correlation coefficient (R) of -0.029 and weighted average of 16.8%, a difference of 23.5%.
Single Female Poverty Correlation Summary
| Measurement | Lebanese | Immigrants from India |
| Minimum | 5.5% | 2.0% |
| Maximum | 100.0% | 35.8% |
| Range | 94.5% | 33.8% |
| Mean | 34.4% | 15.0% |
| Median | 21.5% | 14.4% |
| Interquartile 25% (IQ1) | 15.8% | 11.9% |
| Interquartile 75% (IQ3) | 40.4% | 17.4% |
| Interquartile Range (IQR) | 24.6% | 5.5% |
| Standard Deviation (Sample) | 28.2% | 5.1% |
| Standard Deviation (Population) | 27.7% | 5.0% |
Similar Demographics by Single Female Poverty
Demographics Similar to Lebanese by Single Female Poverty
In terms of single female poverty, the demographic groups most similar to Lebanese are Northern European (20.8%, a difference of 0.050%), Kenyan (20.8%, a difference of 0.060%), Iraqi (20.8%, a difference of 0.22%), Arab (20.7%, a difference of 0.24%), and Ugandan (20.8%, a difference of 0.26%).
| Demographics | Rating | Rank | Single Female Poverty |
| South American Indians | 75.7 /100 | #156 | Good 20.6% |
| Immigrants | Oceania | 74.3 /100 | #157 | Good 20.7% |
| Danes | 73.0 /100 | #158 | Good 20.7% |
| Costa Ricans | 71.8 /100 | #159 | Good 20.7% |
| Arabs | 70.8 /100 | #160 | Good 20.7% |
| Kenyans | 68.5 /100 | #161 | Good 20.8% |
| Northern Europeans | 68.4 /100 | #162 | Good 20.8% |
| Lebanese | 67.6 /100 | #163 | Good 20.8% |
| Iraqis | 64.5 /100 | #164 | Good 20.8% |
| Ugandans | 64.0 /100 | #165 | Good 20.8% |
| Norwegians | 63.0 /100 | #166 | Good 20.8% |
| Immigrants | Norway | 63.0 /100 | #167 | Good 20.8% |
| Immigrants | Costa Rica | 61.5 /100 | #168 | Good 20.9% |
| Immigrants | Trinidad and Tobago | 56.3 /100 | #169 | Average 20.9% |
| New Zealanders | 53.2 /100 | #170 | Average 21.0% |
Demographics Similar to Immigrants from India by Single Female Poverty
In terms of single female poverty, the demographic groups most similar to Immigrants from India are Assyrian/Chaldean/Syriac (17.0%, a difference of 0.83%), Filipino (17.0%, a difference of 1.0%), Immigrants from Hong Kong (16.5%, a difference of 1.7%), Thai (17.3%, a difference of 2.8%), and Immigrants from Taiwan (16.4%, a difference of 2.8%).
| Demographics | Rating | Rank | Single Female Poverty |
| Chinese | 100.0 /100 | #1 | Exceptional 16.1% |
| Immigrants | Taiwan | 100.0 /100 | #2 | Exceptional 16.4% |
| Immigrants | Hong Kong | 100.0 /100 | #3 | Exceptional 16.5% |
| Immigrants | India | 100.0 /100 | #4 | Exceptional 16.8% |
| Assyrians/Chaldeans/Syriacs | 100.0 /100 | #5 | Exceptional 17.0% |
| Filipinos | 100.0 /100 | #6 | Exceptional 17.0% |
| Thais | 100.0 /100 | #7 | Exceptional 17.3% |
| Immigrants | Iran | 100.0 /100 | #8 | Exceptional 17.5% |
| Bhutanese | 100.0 /100 | #9 | Exceptional 17.7% |
| Immigrants | Ireland | 100.0 /100 | #10 | Exceptional 17.8% |
| Immigrants | Lithuania | 100.0 /100 | #11 | Exceptional 17.8% |
| Immigrants | South Central Asia | 100.0 /100 | #12 | Exceptional 17.8% |
| Immigrants | Bolivia | 100.0 /100 | #13 | Exceptional 17.8% |
| Bolivians | 100.0 /100 | #14 | Exceptional 17.9% |
| Indians (Asian) | 100.0 /100 | #15 | Exceptional 17.9% |