Asian vs Immigrants from India 1 or more Vehicles in Household
COMPARE
Asian
Immigrants from India
1 or more Vehicles in Household
1 or more Vehicles in Household Comparison
Asians
Immigrants from India
91.1%
1 OR MORE VEHICLES IN HOUSEHOLD
98.2/ 100
METRIC RATING
104th/ 347
METRIC RANK
91.9%
1 OR MORE VEHICLES IN HOUSEHOLD
99.8/ 100
METRIC RATING
61st/ 347
METRIC RANK
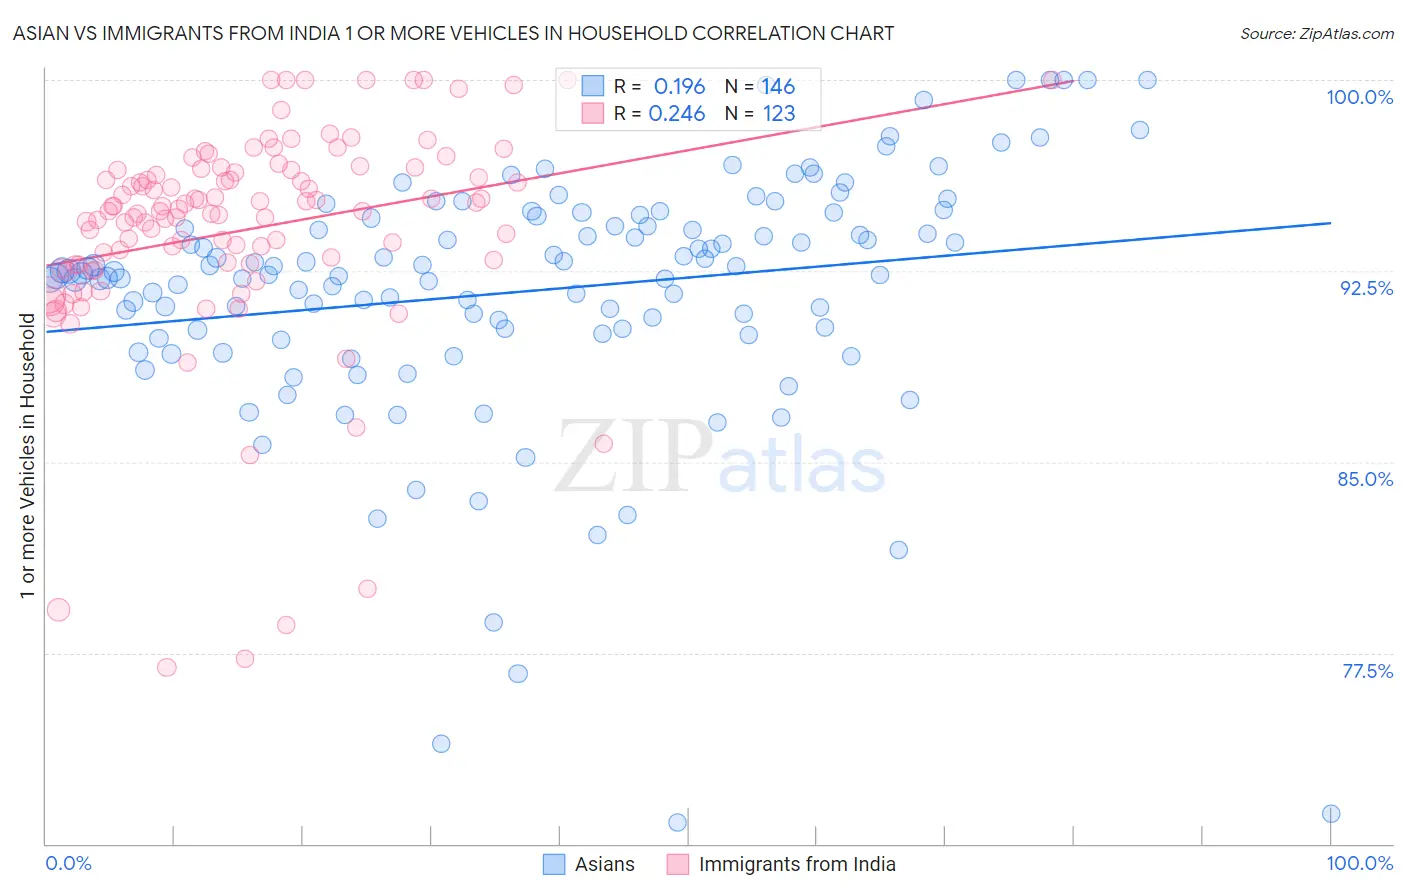
Asian vs Immigrants from India 1 or more Vehicles in Household Correlation Chart
The statistical analysis conducted on geographies consisting of 538,010,988 people shows a poor positive correlation between the proportion of Asians and percentage of households with 1 or more vehicles available in the United States with a correlation coefficient (R) of 0.196 and weighted average of 91.1%. Similarly, the statistical analysis conducted on geographies consisting of 433,708,630 people shows a weak positive correlation between the proportion of Immigrants from India and percentage of households with 1 or more vehicles available in the United States with a correlation coefficient (R) of 0.246 and weighted average of 91.9%, a difference of 0.87%.
1 or more Vehicles in Household Correlation Summary
| Measurement | Asian | Immigrants from India |
| Minimum | 70.8% | 76.9% |
| Maximum | 100.0% | 100.0% |
| Range | 29.2% | 23.1% |
| Mean | 91.7% | 94.1% |
| Median | 92.4% | 94.9% |
| Interquartile 25% (IQ1) | 90.2% | 92.7% |
| Interquartile 75% (IQ3) | 94.6% | 96.5% |
| Interquartile Range (IQR) | 4.4% | 3.7% |
| Standard Deviation (Sample) | 5.0% | 4.3% |
| Standard Deviation (Population) | 4.9% | 4.3% |
Similar Demographics by 1 or more Vehicles in Household
Demographics Similar to Asians by 1 or more Vehicles in Household
In terms of 1 or more vehicles in household, the demographic groups most similar to Asians are Yugoslavian (91.1%, a difference of 0.010%), Seminole (91.1%, a difference of 0.020%), Bulgarian (91.1%, a difference of 0.040%), Laotian (91.0%, a difference of 0.040%), and Immigrants from Central America (91.1%, a difference of 0.050%).
| Demographics | Rating | Rank | 1 or more Vehicles in Household |
| Pakistanis | 99.0 /100 | #97 | Exceptional 91.3% |
| Slavs | 98.7 /100 | #98 | Exceptional 91.2% |
| Immigrants | Bolivia | 98.6 /100 | #99 | Exceptional 91.2% |
| Immigrants | Central America | 98.4 /100 | #100 | Exceptional 91.1% |
| Bulgarians | 98.4 /100 | #101 | Exceptional 91.1% |
| Seminole | 98.3 /100 | #102 | Exceptional 91.1% |
| Yugoslavians | 98.3 /100 | #103 | Exceptional 91.1% |
| Asians | 98.2 /100 | #104 | Exceptional 91.1% |
| Laotians | 98.0 /100 | #105 | Exceptional 91.0% |
| Zimbabweans | 97.7 /100 | #106 | Exceptional 91.0% |
| Maltese | 97.7 /100 | #107 | Exceptional 91.0% |
| Hispanics or Latinos | 97.6 /100 | #108 | Exceptional 91.0% |
| Delaware | 97.6 /100 | #109 | Exceptional 91.0% |
| Mexican American Indians | 97.4 /100 | #110 | Exceptional 91.0% |
| Navajo | 95.8 /100 | #111 | Exceptional 90.8% |
Demographics Similar to Immigrants from India by 1 or more Vehicles in Household
In terms of 1 or more vehicles in household, the demographic groups most similar to Immigrants from India are Thai (91.9%, a difference of 0.0%), Slovak (91.9%, a difference of 0.010%), Chinese (91.9%, a difference of 0.030%), Croatian (91.9%, a difference of 0.030%), and Venezuelan (91.9%, a difference of 0.040%).
| Demographics | Rating | Rank | 1 or more Vehicles in Household |
| Slovenes | 99.9 /100 | #54 | Exceptional 92.0% |
| Immigrants | Afghanistan | 99.9 /100 | #55 | Exceptional 92.0% |
| Immigrants | Venezuela | 99.9 /100 | #56 | Exceptional 92.0% |
| Iraqis | 99.8 /100 | #57 | Exceptional 91.9% |
| Immigrants | Mexico | 99.8 /100 | #58 | Exceptional 91.9% |
| Venezuelans | 99.8 /100 | #59 | Exceptional 91.9% |
| Slovaks | 99.8 /100 | #60 | Exceptional 91.9% |
| Immigrants | India | 99.8 /100 | #61 | Exceptional 91.9% |
| Thais | 99.8 /100 | #62 | Exceptional 91.9% |
| Chinese | 99.8 /100 | #63 | Exceptional 91.9% |
| Croatians | 99.8 /100 | #64 | Exceptional 91.9% |
| Immigrants | Laos | 99.8 /100 | #65 | Exceptional 91.8% |
| Canadians | 99.8 /100 | #66 | Exceptional 91.8% |
| Spaniards | 99.8 /100 | #67 | Exceptional 91.8% |
| Immigrants | Scotland | 99.7 /100 | #68 | Exceptional 91.8% |