Immigrants from Western Africa vs Immigrants from India Single Female Poverty
COMPARE
Immigrants from Western Africa
Immigrants from India
Single Female Poverty
Single Female Poverty Comparison
Immigrants from Western Africa
Immigrants from India
22.0%
SINGLE FEMALE POVERTY
5.3/ 100
METRIC RATING
230th/ 347
METRIC RANK
16.8%
SINGLE FEMALE POVERTY
100.0/ 100
METRIC RATING
4th/ 347
METRIC RANK
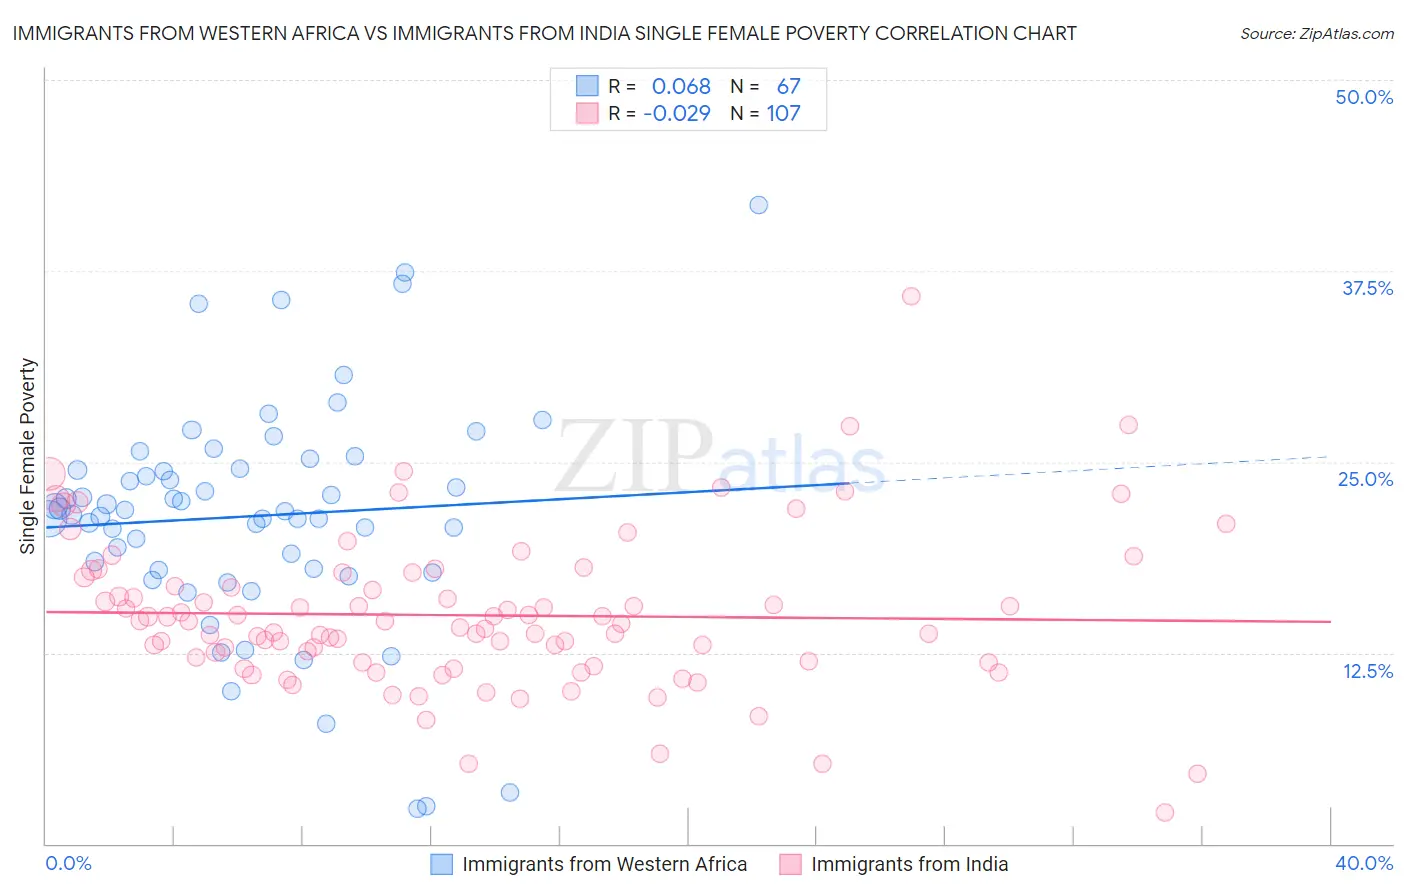
Immigrants from Western Africa vs Immigrants from India Single Female Poverty Correlation Chart
The statistical analysis conducted on geographies consisting of 354,181,306 people shows a slight positive correlation between the proportion of Immigrants from Western Africa and poverty level among single females in the United States with a correlation coefficient (R) of 0.068 and weighted average of 22.0%. Similarly, the statistical analysis conducted on geographies consisting of 425,520,068 people shows no correlation between the proportion of Immigrants from India and poverty level among single females in the United States with a correlation coefficient (R) of -0.029 and weighted average of 16.8%, a difference of 30.6%.
Single Female Poverty Correlation Summary
| Measurement | Immigrants from Western Africa | Immigrants from India |
| Minimum | 2.3% | 2.0% |
| Maximum | 41.8% | 35.8% |
| Range | 39.5% | 33.8% |
| Mean | 21.4% | 15.0% |
| Median | 21.8% | 14.4% |
| Interquartile 25% (IQ1) | 18.0% | 11.9% |
| Interquartile 75% (IQ3) | 24.5% | 17.4% |
| Interquartile Range (IQR) | 6.6% | 5.5% |
| Standard Deviation (Sample) | 7.4% | 5.1% |
| Standard Deviation (Population) | 7.4% | 5.0% |
Similar Demographics by Single Female Poverty
Demographics Similar to Immigrants from Western Africa by Single Female Poverty
In terms of single female poverty, the demographic groups most similar to Immigrants from Western Africa are Tlingit-Haida (21.9%, a difference of 0.020%), Salvadoran (21.9%, a difference of 0.050%), Welsh (22.0%, a difference of 0.090%), Immigrants from Thailand (22.0%, a difference of 0.10%), and Immigrants from Ghana (21.9%, a difference of 0.14%).
| Demographics | Rating | Rank | Single Female Poverty |
| Scottish | 7.3 /100 | #223 | Tragic 21.8% |
| Barbadians | 7.2 /100 | #224 | Tragic 21.8% |
| English | 6.4 /100 | #225 | Tragic 21.9% |
| Immigrants | Portugal | 5.8 /100 | #226 | Tragic 21.9% |
| Immigrants | Ghana | 5.8 /100 | #227 | Tragic 21.9% |
| Salvadorans | 5.5 /100 | #228 | Tragic 21.9% |
| Tlingit-Haida | 5.4 /100 | #229 | Tragic 21.9% |
| Immigrants | Western Africa | 5.3 /100 | #230 | Tragic 22.0% |
| Welsh | 5.0 /100 | #231 | Tragic 22.0% |
| Immigrants | Thailand | 5.0 /100 | #232 | Tragic 22.0% |
| Spaniards | 4.7 /100 | #233 | Tragic 22.0% |
| Spanish | 4.7 /100 | #234 | Tragic 22.0% |
| Dutch | 4.6 /100 | #235 | Tragic 22.0% |
| Immigrants | Ecuador | 4.2 /100 | #236 | Tragic 22.0% |
| Vietnamese | 4.0 /100 | #237 | Tragic 22.0% |
Demographics Similar to Immigrants from India by Single Female Poverty
In terms of single female poverty, the demographic groups most similar to Immigrants from India are Assyrian/Chaldean/Syriac (17.0%, a difference of 0.83%), Filipino (17.0%, a difference of 1.0%), Immigrants from Hong Kong (16.5%, a difference of 1.7%), Thai (17.3%, a difference of 2.8%), and Immigrants from Taiwan (16.4%, a difference of 2.8%).
| Demographics | Rating | Rank | Single Female Poverty |
| Chinese | 100.0 /100 | #1 | Exceptional 16.1% |
| Immigrants | Taiwan | 100.0 /100 | #2 | Exceptional 16.4% |
| Immigrants | Hong Kong | 100.0 /100 | #3 | Exceptional 16.5% |
| Immigrants | India | 100.0 /100 | #4 | Exceptional 16.8% |
| Assyrians/Chaldeans/Syriacs | 100.0 /100 | #5 | Exceptional 17.0% |
| Filipinos | 100.0 /100 | #6 | Exceptional 17.0% |
| Thais | 100.0 /100 | #7 | Exceptional 17.3% |
| Immigrants | Iran | 100.0 /100 | #8 | Exceptional 17.5% |
| Bhutanese | 100.0 /100 | #9 | Exceptional 17.7% |
| Immigrants | Ireland | 100.0 /100 | #10 | Exceptional 17.8% |
| Immigrants | Lithuania | 100.0 /100 | #11 | Exceptional 17.8% |
| Immigrants | South Central Asia | 100.0 /100 | #12 | Exceptional 17.8% |
| Immigrants | Bolivia | 100.0 /100 | #13 | Exceptional 17.8% |
| Bolivians | 100.0 /100 | #14 | Exceptional 17.9% |
| Indians (Asian) | 100.0 /100 | #15 | Exceptional 17.9% |