Armenian vs Irish 4 or more Vehicles in Household
COMPARE
Armenian
Irish
4 or more Vehicles in Household
4 or more Vehicles in Household Comparison
Armenians
Irish
6.6%
4 OR MORE VEHICLES IN HOUSEHOLD
86.9/ 100
METRIC RATING
133rd/ 347
METRIC RANK
7.1%
4 OR MORE VEHICLES IN HOUSEHOLD
99.0/ 100
METRIC RATING
98th/ 347
METRIC RANK
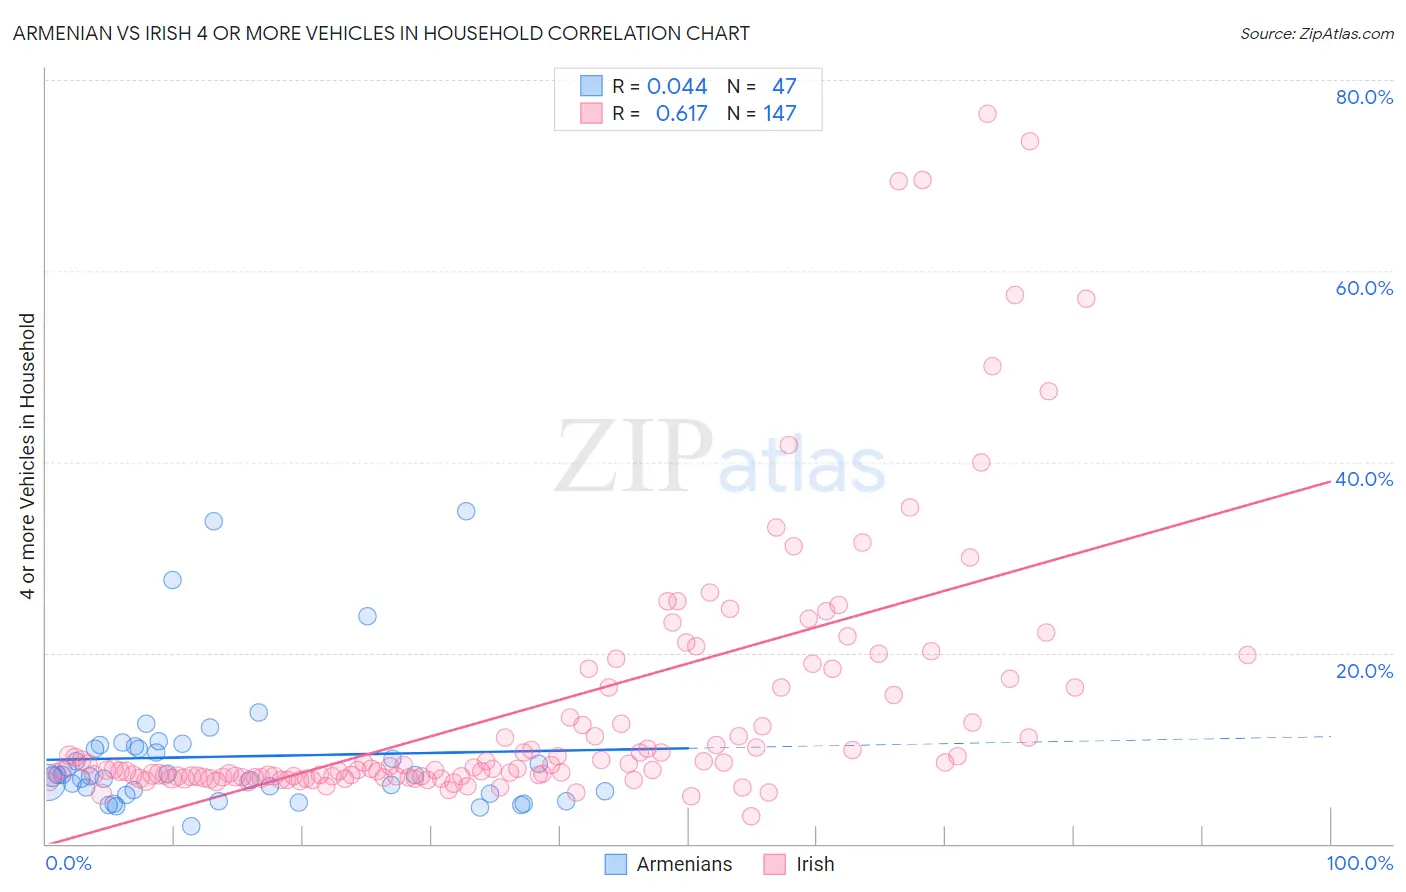
Armenian vs Irish 4 or more Vehicles in Household Correlation Chart
The statistical analysis conducted on geographies consisting of 309,582,148 people shows no correlation between the proportion of Armenians and percentage of households with 4 or more vehicles available in the United States with a correlation coefficient (R) of 0.044 and weighted average of 6.6%. Similarly, the statistical analysis conducted on geographies consisting of 576,295,994 people shows a significant positive correlation between the proportion of Irish and percentage of households with 4 or more vehicles available in the United States with a correlation coefficient (R) of 0.617 and weighted average of 7.1%, a difference of 6.5%.
4 or more Vehicles in Household Correlation Summary
| Measurement | Armenian | Irish |
| Minimum | 1.8% | 2.8% |
| Maximum | 34.8% | 76.5% |
| Range | 33.0% | 73.6% |
| Mean | 9.1% | 14.2% |
| Median | 7.1% | 7.9% |
| Interquartile 25% (IQ1) | 5.3% | 7.0% |
| Interquartile 75% (IQ3) | 10.2% | 16.4% |
| Interquartile Range (IQR) | 4.9% | 9.4% |
| Standard Deviation (Sample) | 7.1% | 14.0% |
| Standard Deviation (Population) | 7.0% | 14.0% |
Similar Demographics by 4 or more Vehicles in Household
Demographics Similar to Armenians by 4 or more Vehicles in Household
In terms of 4 or more vehicles in household, the demographic groups most similar to Armenians are Ottawa (6.6%, a difference of 0.020%), Tohono O'odham (6.6%, a difference of 0.050%), Luxembourger (6.6%, a difference of 0.11%), Immigrants from Netherlands (6.6%, a difference of 0.19%), and French Canadian (6.6%, a difference of 0.32%).
| Demographics | Rating | Rank | 4 or more Vehicles in Household |
| Belgians | 94.1 /100 | #126 | Exceptional 6.8% |
| Immigrants | Korea | 93.8 /100 | #127 | Exceptional 6.8% |
| Immigrants | Bolivia | 92.5 /100 | #128 | Exceptional 6.7% |
| Immigrants | England | 92.0 /100 | #129 | Exceptional 6.7% |
| Immigrants | Scotland | 89.0 /100 | #130 | Excellent 6.7% |
| Maltese | 88.4 /100 | #131 | Excellent 6.7% |
| Immigrants | Netherlands | 87.8 /100 | #132 | Excellent 6.6% |
| Armenians | 86.9 /100 | #133 | Excellent 6.6% |
| Ottawa | 86.9 /100 | #134 | Excellent 6.6% |
| Tohono O'odham | 86.7 /100 | #135 | Excellent 6.6% |
| Luxembourgers | 86.4 /100 | #136 | Excellent 6.6% |
| French Canadians | 85.4 /100 | #137 | Excellent 6.6% |
| Italians | 84.5 /100 | #138 | Excellent 6.6% |
| Jordanians | 82.1 /100 | #139 | Excellent 6.6% |
| Slavs | 81.6 /100 | #140 | Excellent 6.6% |
Demographics Similar to Irish by 4 or more Vehicles in Household
In terms of 4 or more vehicles in household, the demographic groups most similar to Irish are Celtic (7.1%, a difference of 0.42%), Seminole (7.0%, a difference of 0.44%), Taiwanese (7.0%, a difference of 0.52%), Pakistani (7.0%, a difference of 0.59%), and Asian (7.0%, a difference of 0.66%).
| Demographics | Rating | Rank | 4 or more Vehicles in Household |
| Assyrians/Chaldeans/Syriacs | 99.4 /100 | #91 | Exceptional 7.2% |
| Immigrants | Latin America | 99.4 /100 | #92 | Exceptional 7.1% |
| Immigrants | Afghanistan | 99.3 /100 | #93 | Exceptional 7.1% |
| Dutch West Indians | 99.3 /100 | #94 | Exceptional 7.1% |
| Czechoslovakians | 99.3 /100 | #95 | Exceptional 7.1% |
| Central Americans | 99.3 /100 | #96 | Exceptional 7.1% |
| Celtics | 99.1 /100 | #97 | Exceptional 7.1% |
| Irish | 99.0 /100 | #98 | Exceptional 7.1% |
| Seminole | 98.8 /100 | #99 | Exceptional 7.0% |
| Taiwanese | 98.7 /100 | #100 | Exceptional 7.0% |
| Pakistanis | 98.7 /100 | #101 | Exceptional 7.0% |
| Asians | 98.6 /100 | #102 | Exceptional 7.0% |
| Blackfeet | 98.6 /100 | #103 | Exceptional 7.0% |
| Hmong | 98.3 /100 | #104 | Exceptional 7.0% |
| German Russians | 98.3 /100 | #105 | Exceptional 7.0% |