Armenian vs Immigrants from South Eastern Asia Family Households
COMPARE
Armenian
Immigrants from South Eastern Asia
Family Households
Family Households Comparison
Armenians
Immigrants from South Eastern Asia
64.4%
FAMILY HOUSEHOLDS
55.9/ 100
METRIC RATING
170th/ 347
METRIC RANK
67.5%
FAMILY HOUSEHOLDS
100.0/ 100
METRIC RATING
24th/ 347
METRIC RANK
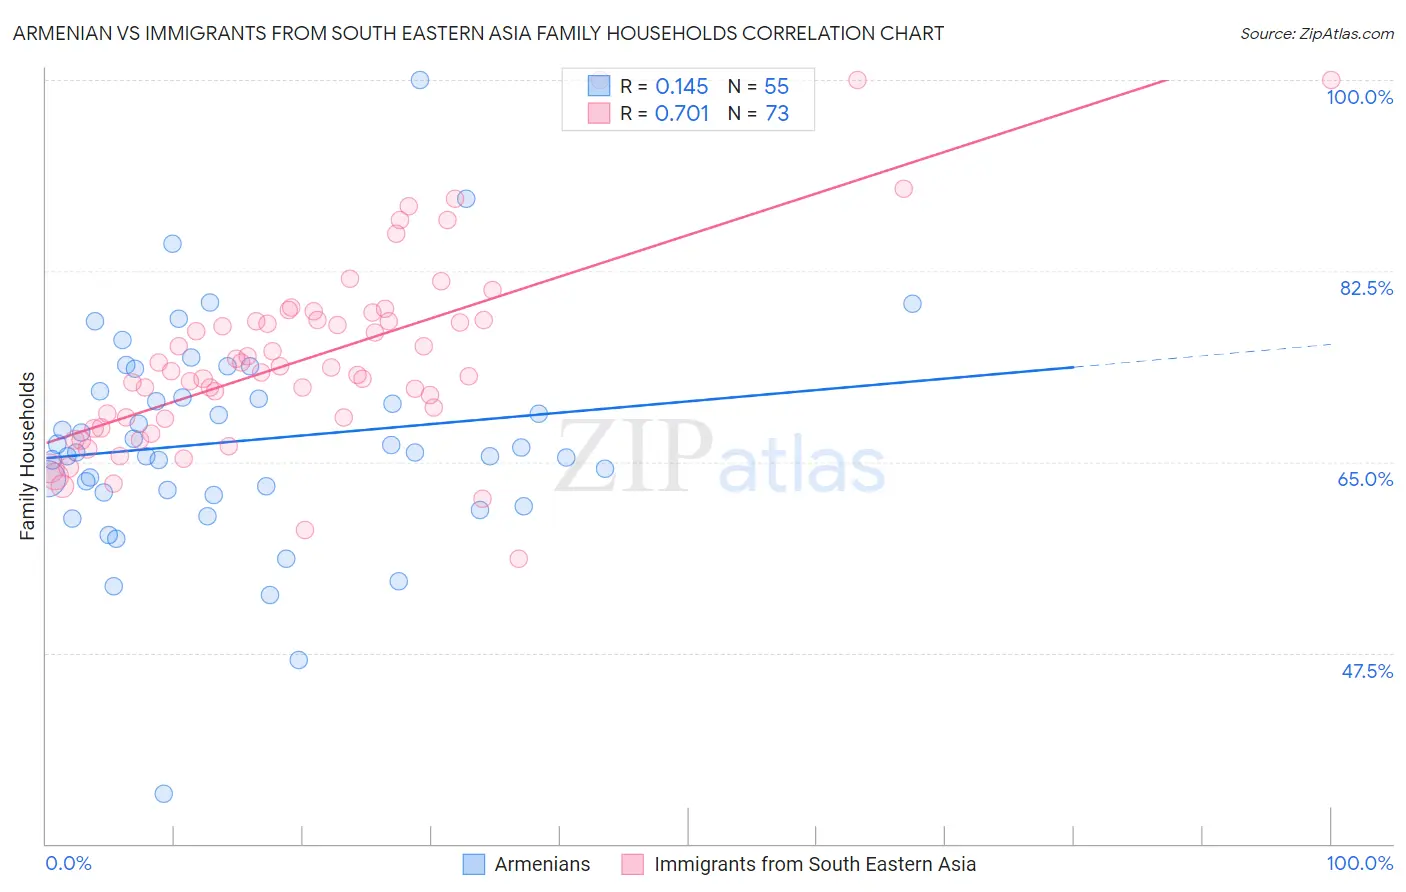
Armenian vs Immigrants from South Eastern Asia Family Households Correlation Chart
The statistical analysis conducted on geographies consisting of 310,784,197 people shows a poor positive correlation between the proportion of Armenians and percentage of family households in the United States with a correlation coefficient (R) of 0.145 and weighted average of 64.4%. Similarly, the statistical analysis conducted on geographies consisting of 512,232,151 people shows a strong positive correlation between the proportion of Immigrants from South Eastern Asia and percentage of family households in the United States with a correlation coefficient (R) of 0.701 and weighted average of 67.5%, a difference of 4.9%.
Family Households Correlation Summary
| Measurement | Armenian | Immigrants from South Eastern Asia |
| Minimum | 34.5% | 56.2% |
| Maximum | 100.0% | 100.0% |
| Range | 65.5% | 43.8% |
| Mean | 66.9% | 74.5% |
| Median | 65.9% | 73.4% |
| Interquartile 25% (IQ1) | 62.2% | 68.5% |
| Interquartile 75% (IQ3) | 71.4% | 78.0% |
| Interquartile Range (IQR) | 9.3% | 9.4% |
| Standard Deviation (Sample) | 10.1% | 8.8% |
| Standard Deviation (Population) | 10.0% | 8.7% |
Similar Demographics by Family Households
Demographics Similar to Armenians by Family Households
In terms of family households, the demographic groups most similar to Armenians are Iraqi (64.4%, a difference of 0.0%), Honduran (64.4%, a difference of 0.020%), Ute (64.3%, a difference of 0.020%), Irish (64.4%, a difference of 0.030%), and Dutch West Indian (64.3%, a difference of 0.030%).
| Demographics | Rating | Rank | Family Households |
| Chickasaw | 61.5 /100 | #163 | Good 64.4% |
| Immigrants | Nigeria | 60.1 /100 | #164 | Good 64.4% |
| Immigrants | Southern Europe | 60.0 /100 | #165 | Good 64.4% |
| Scotch-Irish | 59.2 /100 | #166 | Average 64.4% |
| Irish | 57.9 /100 | #167 | Average 64.4% |
| Hondurans | 57.5 /100 | #168 | Average 64.4% |
| Iraqis | 56.0 /100 | #169 | Average 64.4% |
| Armenians | 55.9 /100 | #170 | Average 64.4% |
| Ute | 54.6 /100 | #171 | Average 64.3% |
| Dutch West Indians | 53.9 /100 | #172 | Average 64.3% |
| Immigrants | Sierra Leone | 52.5 /100 | #173 | Average 64.3% |
| Immigrants | Germany | 50.0 /100 | #174 | Average 64.3% |
| Bangladeshis | 44.3 /100 | #175 | Average 64.3% |
| Vietnamese | 43.6 /100 | #176 | Average 64.2% |
| Immigrants | Micronesia | 42.3 /100 | #177 | Average 64.2% |
Demographics Similar to Immigrants from South Eastern Asia by Family Households
In terms of family households, the demographic groups most similar to Immigrants from South Eastern Asia are Immigrants from Nicaragua (67.5%, a difference of 0.020%), Immigrants from India (67.4%, a difference of 0.040%), Hispanic or Latino (67.4%, a difference of 0.080%), Hawaiian (67.4%, a difference of 0.090%), and Nicaraguan (67.4%, a difference of 0.16%).
| Demographics | Rating | Rank | Family Households |
| Chinese | 100.0 /100 | #17 | Exceptional 68.1% |
| Immigrants | Taiwan | 100.0 /100 | #18 | Exceptional 68.0% |
| Samoans | 100.0 /100 | #19 | Exceptional 67.9% |
| Inupiat | 100.0 /100 | #20 | Exceptional 67.8% |
| Cubans | 100.0 /100 | #21 | Exceptional 67.7% |
| Sri Lankans | 100.0 /100 | #22 | Exceptional 67.7% |
| Immigrants | Pakistan | 100.0 /100 | #23 | Exceptional 67.7% |
| Immigrants | South Eastern Asia | 100.0 /100 | #24 | Exceptional 67.5% |
| Immigrants | Nicaragua | 100.0 /100 | #25 | Exceptional 67.5% |
| Immigrants | India | 100.0 /100 | #26 | Exceptional 67.4% |
| Hispanics or Latinos | 100.0 /100 | #27 | Exceptional 67.4% |
| Hawaiians | 100.0 /100 | #28 | Exceptional 67.4% |
| Nicaraguans | 100.0 /100 | #29 | Exceptional 67.4% |
| Immigrants | Peru | 100.0 /100 | #30 | Exceptional 67.2% |
| Immigrants | Latin America | 100.0 /100 | #31 | Exceptional 67.2% |