Arapaho vs Immigrants from Russia Single Female Poverty
COMPARE
Arapaho
Immigrants from Russia
Single Female Poverty
Single Female Poverty Comparison
Arapaho
Immigrants from Russia
26.4%
SINGLE FEMALE POVERTY
0.0/ 100
METRIC RATING
320th/ 347
METRIC RANK
19.4%
SINGLE FEMALE POVERTY
99.3/ 100
METRIC RATING
77th/ 347
METRIC RANK
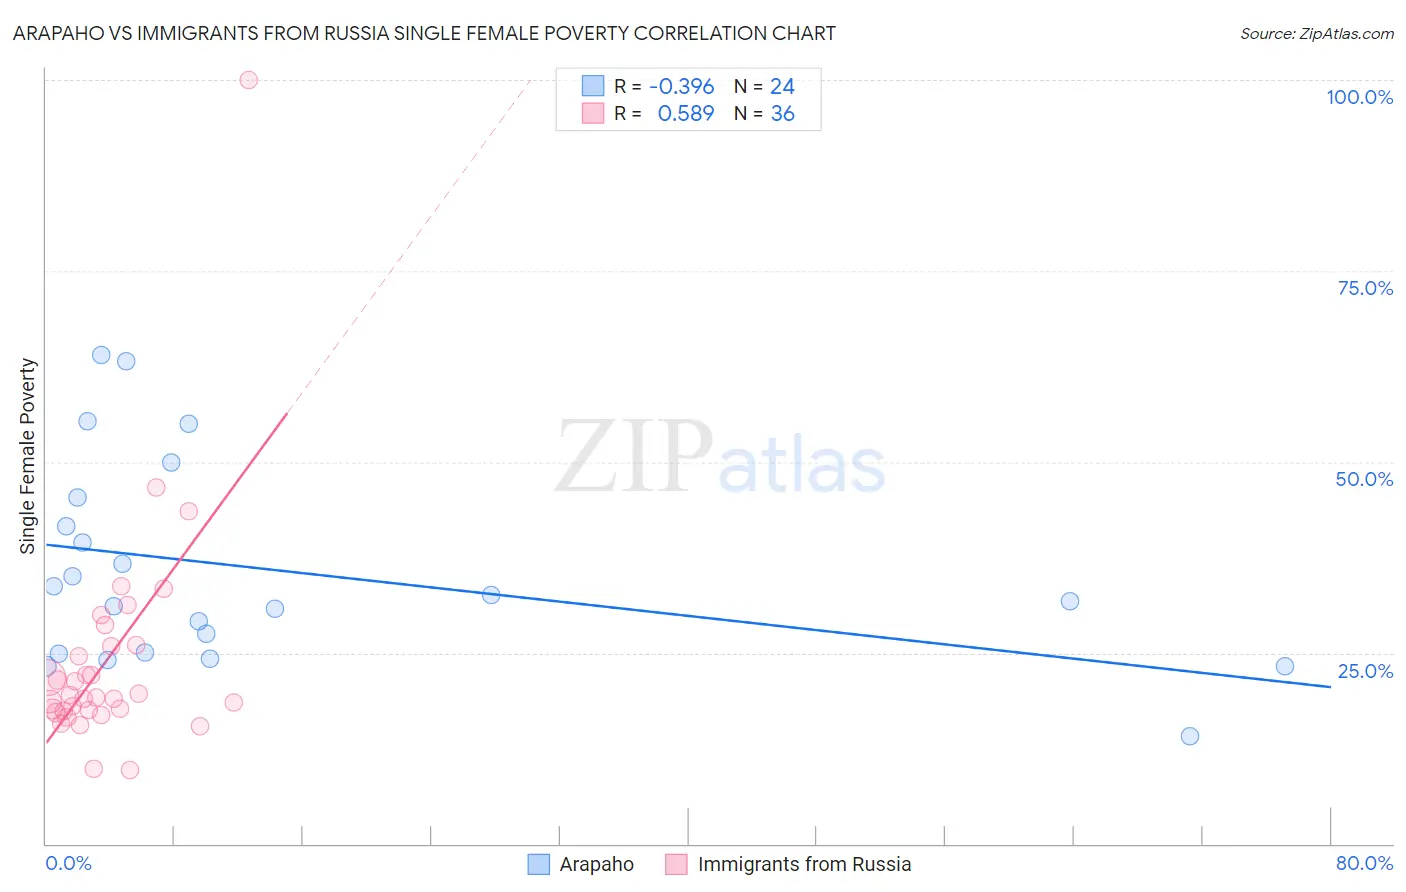
Arapaho vs Immigrants from Russia Single Female Poverty Correlation Chart
The statistical analysis conducted on geographies consisting of 29,687,271 people shows a mild negative correlation between the proportion of Arapaho and poverty level among single females in the United States with a correlation coefficient (R) of -0.396 and weighted average of 26.4%. Similarly, the statistical analysis conducted on geographies consisting of 342,303,580 people shows a substantial positive correlation between the proportion of Immigrants from Russia and poverty level among single females in the United States with a correlation coefficient (R) of 0.589 and weighted average of 19.4%, a difference of 36.3%.
Single Female Poverty Correlation Summary
| Measurement | Arapaho | Immigrants from Russia |
| Minimum | 14.1% | 9.7% |
| Maximum | 63.9% | 100.0% |
| Range | 49.8% | 90.3% |
| Mean | 35.9% | 24.2% |
| Median | 32.1% | 19.3% |
| Interquartile 25% (IQ1) | 25.0% | 17.4% |
| Interquartile 75% (IQ3) | 43.4% | 25.9% |
| Interquartile Range (IQR) | 18.5% | 8.5% |
| Standard Deviation (Sample) | 13.4% | 15.3% |
| Standard Deviation (Population) | 13.1% | 15.0% |
Similar Demographics by Single Female Poverty
Demographics Similar to Arapaho by Single Female Poverty
In terms of single female poverty, the demographic groups most similar to Arapaho are Black/African American (26.4%, a difference of 0.30%), Chickasaw (26.3%, a difference of 0.63%), Yup'ik (26.6%, a difference of 0.64%), Seminole (26.8%, a difference of 1.4%), and Chippewa (26.8%, a difference of 1.5%).
| Demographics | Rating | Rank | Single Female Poverty |
| Comanche | 0.0 /100 | #313 | Tragic 25.6% |
| Cherokee | 0.0 /100 | #314 | Tragic 25.7% |
| Iroquois | 0.0 /100 | #315 | Tragic 25.7% |
| Immigrants | Somalia | 0.0 /100 | #316 | Tragic 25.8% |
| Ottawa | 0.0 /100 | #317 | Tragic 26.0% |
| Chickasaw | 0.0 /100 | #318 | Tragic 26.3% |
| Blacks/African Americans | 0.0 /100 | #319 | Tragic 26.4% |
| Arapaho | 0.0 /100 | #320 | Tragic 26.4% |
| Yup'ik | 0.0 /100 | #321 | Tragic 26.6% |
| Seminole | 0.0 /100 | #322 | Tragic 26.8% |
| Chippewa | 0.0 /100 | #323 | Tragic 26.8% |
| Kiowa | 0.0 /100 | #324 | Tragic 26.9% |
| Choctaw | 0.0 /100 | #325 | Tragic 27.2% |
| Creek | 0.0 /100 | #326 | Tragic 27.4% |
| Dutch West Indians | 0.0 /100 | #327 | Tragic 27.5% |
Demographics Similar to Immigrants from Russia by Single Female Poverty
In terms of single female poverty, the demographic groups most similar to Immigrants from Russia are Albanian (19.4%, a difference of 0.070%), Immigrants from Sierra Leone (19.4%, a difference of 0.090%), Peruvian (19.4%, a difference of 0.13%), Immigrants from Australia (19.4%, a difference of 0.13%), and Immigrants from Scotland (19.4%, a difference of 0.15%).
| Demographics | Rating | Rank | Single Female Poverty |
| Immigrants | Jordan | 99.4 /100 | #70 | Exceptional 19.3% |
| Immigrants | South Eastern Asia | 99.4 /100 | #71 | Exceptional 19.3% |
| Immigrants | Latvia | 99.4 /100 | #72 | Exceptional 19.3% |
| Immigrants | Peru | 99.4 /100 | #73 | Exceptional 19.3% |
| Immigrants | Belarus | 99.4 /100 | #74 | Exceptional 19.3% |
| Immigrants | Turkey | 99.4 /100 | #75 | Exceptional 19.4% |
| Peruvians | 99.4 /100 | #76 | Exceptional 19.4% |
| Immigrants | Russia | 99.3 /100 | #77 | Exceptional 19.4% |
| Albanians | 99.3 /100 | #78 | Exceptional 19.4% |
| Immigrants | Sierra Leone | 99.3 /100 | #79 | Exceptional 19.4% |
| Immigrants | Australia | 99.3 /100 | #80 | Exceptional 19.4% |
| Immigrants | Scotland | 99.2 /100 | #81 | Exceptional 19.4% |
| Immigrants | Malaysia | 99.2 /100 | #82 | Exceptional 19.4% |
| Taiwanese | 99.2 /100 | #83 | Exceptional 19.4% |
| Immigrants | Sweden | 99.2 /100 | #84 | Exceptional 19.4% |