Immigrants from Northern Africa vs Immigrants from Russia Single Female Poverty
COMPARE
Immigrants from Northern Africa
Immigrants from Russia
Single Female Poverty
Single Female Poverty Comparison
Immigrants from Northern Africa
Immigrants from Russia
20.0%
SINGLE FEMALE POVERTY
95.8/ 100
METRIC RATING
115th/ 347
METRIC RANK
19.4%
SINGLE FEMALE POVERTY
99.3/ 100
METRIC RATING
77th/ 347
METRIC RANK
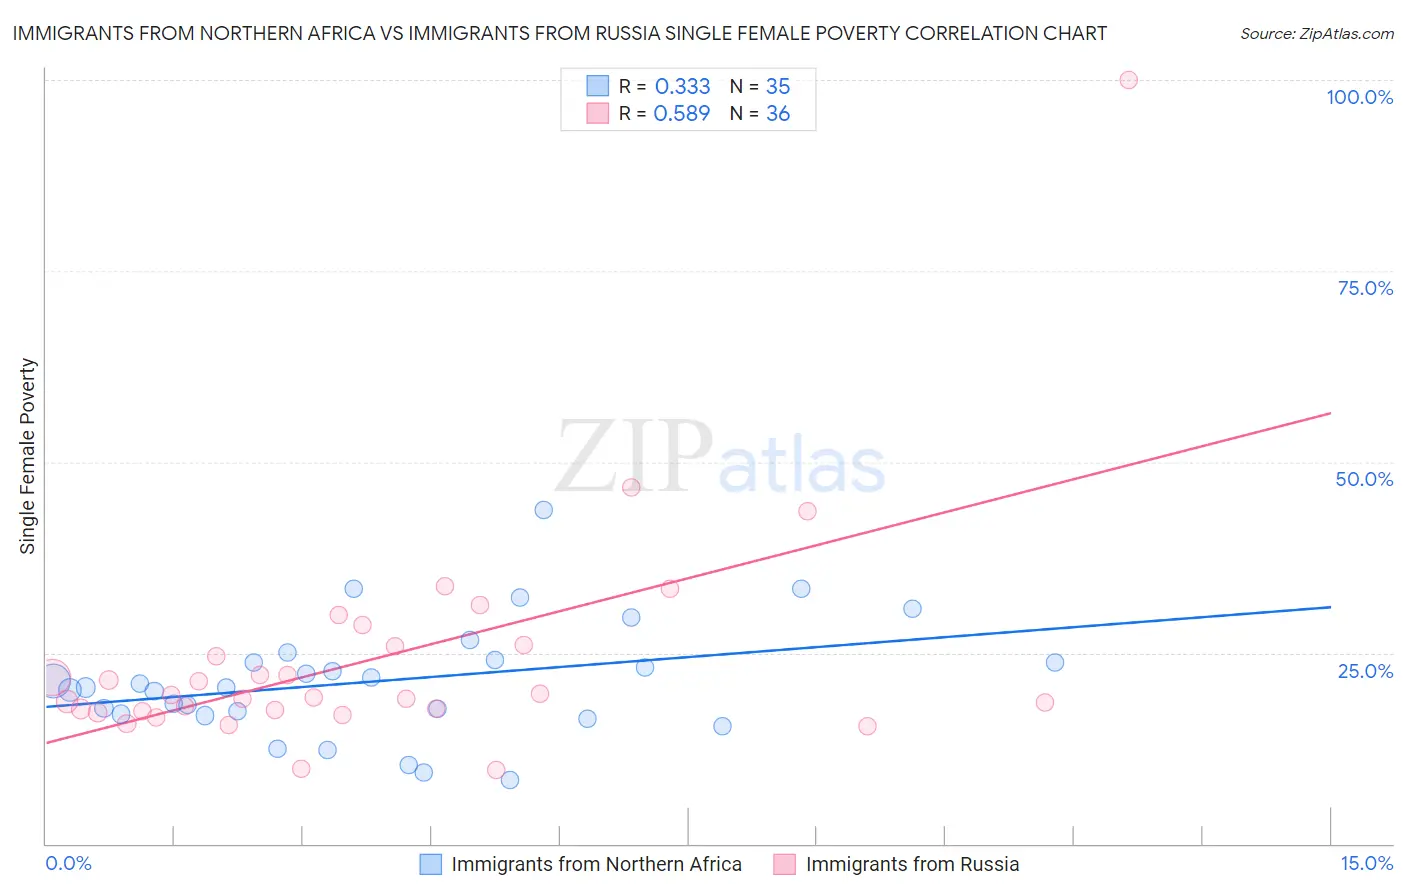
Immigrants from Northern Africa vs Immigrants from Russia Single Female Poverty Correlation Chart
The statistical analysis conducted on geographies consisting of 317,382,257 people shows a mild positive correlation between the proportion of Immigrants from Northern Africa and poverty level among single females in the United States with a correlation coefficient (R) of 0.333 and weighted average of 20.0%. Similarly, the statistical analysis conducted on geographies consisting of 342,303,580 people shows a substantial positive correlation between the proportion of Immigrants from Russia and poverty level among single females in the United States with a correlation coefficient (R) of 0.589 and weighted average of 19.4%, a difference of 3.1%.
Single Female Poverty Correlation Summary
| Measurement | Immigrants from Northern Africa | Immigrants from Russia |
| Minimum | 8.4% | 9.7% |
| Maximum | 43.8% | 100.0% |
| Range | 35.3% | 90.3% |
| Mean | 21.4% | 24.2% |
| Median | 20.4% | 19.3% |
| Interquartile 25% (IQ1) | 17.0% | 17.4% |
| Interquartile 75% (IQ3) | 24.1% | 25.9% |
| Interquartile Range (IQR) | 7.1% | 8.5% |
| Standard Deviation (Sample) | 7.5% | 15.3% |
| Standard Deviation (Population) | 7.4% | 15.0% |
Similar Demographics by Single Female Poverty
Demographics Similar to Immigrants from Northern Africa by Single Female Poverty
In terms of single female poverty, the demographic groups most similar to Immigrants from Northern Africa are Immigrants from Colombia (20.0%, a difference of 0.010%), Immigrants from Zimbabwe (20.0%, a difference of 0.020%), Immigrants from Kazakhstan (20.0%, a difference of 0.040%), Immigrants from Netherlands (20.0%, a difference of 0.070%), and Polish (20.0%, a difference of 0.080%).
| Demographics | Rating | Rank | Single Female Poverty |
| Native Hawaiians | 96.6 /100 | #108 | Exceptional 19.9% |
| Colombians | 96.6 /100 | #109 | Exceptional 19.9% |
| Immigrants | Western Asia | 96.5 /100 | #110 | Exceptional 19.9% |
| Carpatho Rusyns | 96.1 /100 | #111 | Exceptional 20.0% |
| Immigrants | Netherlands | 96.0 /100 | #112 | Exceptional 20.0% |
| Immigrants | Zimbabwe | 95.9 /100 | #113 | Exceptional 20.0% |
| Immigrants | Colombia | 95.9 /100 | #114 | Exceptional 20.0% |
| Immigrants | Northern Africa | 95.8 /100 | #115 | Exceptional 20.0% |
| Immigrants | Kazakhstan | 95.7 /100 | #116 | Exceptional 20.0% |
| Poles | 95.6 /100 | #117 | Exceptional 20.0% |
| Immigrants | Afghanistan | 95.4 /100 | #118 | Exceptional 20.0% |
| Immigrants | Ethiopia | 95.4 /100 | #119 | Exceptional 20.0% |
| South Americans | 95.1 /100 | #120 | Exceptional 20.0% |
| Immigrants | Switzerland | 95.1 /100 | #121 | Exceptional 20.0% |
| Immigrants | South America | 95.0 /100 | #122 | Exceptional 20.0% |
Demographics Similar to Immigrants from Russia by Single Female Poverty
In terms of single female poverty, the demographic groups most similar to Immigrants from Russia are Albanian (19.4%, a difference of 0.070%), Immigrants from Sierra Leone (19.4%, a difference of 0.090%), Peruvian (19.4%, a difference of 0.13%), Immigrants from Australia (19.4%, a difference of 0.13%), and Immigrants from Scotland (19.4%, a difference of 0.15%).
| Demographics | Rating | Rank | Single Female Poverty |
| Immigrants | Jordan | 99.4 /100 | #70 | Exceptional 19.3% |
| Immigrants | South Eastern Asia | 99.4 /100 | #71 | Exceptional 19.3% |
| Immigrants | Latvia | 99.4 /100 | #72 | Exceptional 19.3% |
| Immigrants | Peru | 99.4 /100 | #73 | Exceptional 19.3% |
| Immigrants | Belarus | 99.4 /100 | #74 | Exceptional 19.3% |
| Immigrants | Turkey | 99.4 /100 | #75 | Exceptional 19.4% |
| Peruvians | 99.4 /100 | #76 | Exceptional 19.4% |
| Immigrants | Russia | 99.3 /100 | #77 | Exceptional 19.4% |
| Albanians | 99.3 /100 | #78 | Exceptional 19.4% |
| Immigrants | Sierra Leone | 99.3 /100 | #79 | Exceptional 19.4% |
| Immigrants | Australia | 99.3 /100 | #80 | Exceptional 19.4% |
| Immigrants | Scotland | 99.2 /100 | #81 | Exceptional 19.4% |
| Immigrants | Malaysia | 99.2 /100 | #82 | Exceptional 19.4% |
| Taiwanese | 99.2 /100 | #83 | Exceptional 19.4% |
| Immigrants | Sweden | 99.2 /100 | #84 | Exceptional 19.4% |