West Indian vs Immigrants from Russia Single Female Poverty
COMPARE
West Indian
Immigrants from Russia
Single Female Poverty
Single Female Poverty Comparison
West Indians
Immigrants from Russia
22.3%
SINGLE FEMALE POVERTY
1.9/ 100
METRIC RATING
243rd/ 347
METRIC RANK
19.4%
SINGLE FEMALE POVERTY
99.3/ 100
METRIC RATING
77th/ 347
METRIC RANK
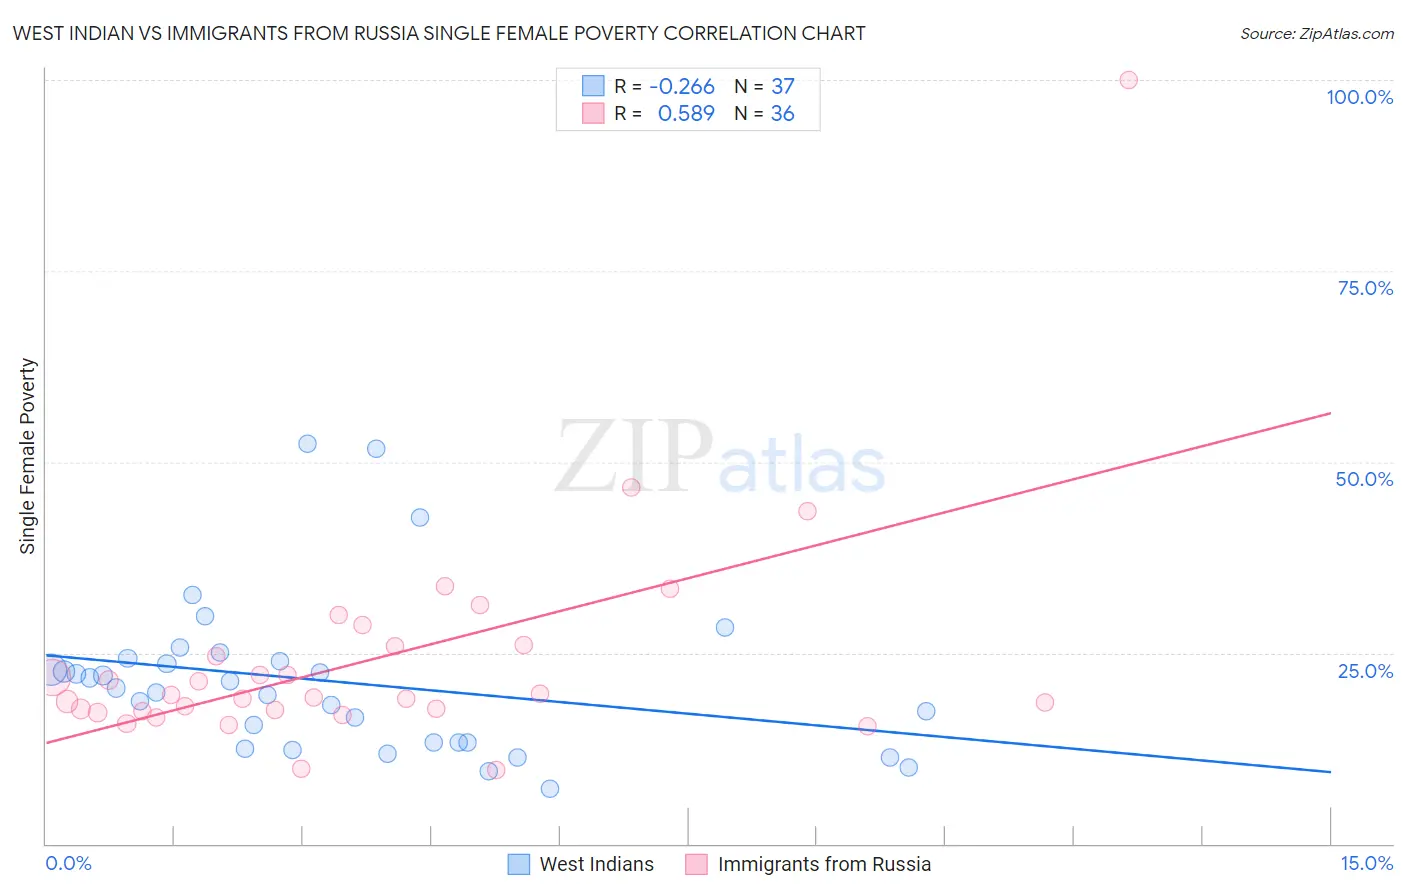
West Indian vs Immigrants from Russia Single Female Poverty Correlation Chart
The statistical analysis conducted on geographies consisting of 252,099,029 people shows a weak negative correlation between the proportion of West Indians and poverty level among single females in the United States with a correlation coefficient (R) of -0.266 and weighted average of 22.3%. Similarly, the statistical analysis conducted on geographies consisting of 342,303,580 people shows a substantial positive correlation between the proportion of Immigrants from Russia and poverty level among single females in the United States with a correlation coefficient (R) of 0.589 and weighted average of 19.4%, a difference of 15.0%.
Single Female Poverty Correlation Summary
| Measurement | West Indian | Immigrants from Russia |
| Minimum | 7.2% | 9.7% |
| Maximum | 52.4% | 100.0% |
| Range | 45.1% | 90.3% |
| Mean | 21.3% | 24.2% |
| Median | 20.4% | 19.3% |
| Interquartile 25% (IQ1) | 13.2% | 17.4% |
| Interquartile 75% (IQ3) | 24.1% | 25.9% |
| Interquartile Range (IQR) | 10.9% | 8.5% |
| Standard Deviation (Sample) | 10.4% | 15.3% |
| Standard Deviation (Population) | 10.2% | 15.0% |
Similar Demographics by Single Female Poverty
Demographics Similar to West Indians by Single Female Poverty
In terms of single female poverty, the demographic groups most similar to West Indians are Immigrants from Middle Africa (22.3%, a difference of 0.010%), Immigrants from Bangladesh (22.3%, a difference of 0.050%), Bermudan (22.3%, a difference of 0.090%), Cape Verdean (22.3%, a difference of 0.16%), and French (22.2%, a difference of 0.30%).
| Demographics | Rating | Rank | Single Female Poverty |
| Immigrants | Ecuador | 4.2 /100 | #236 | Tragic 22.0% |
| Vietnamese | 4.0 /100 | #237 | Tragic 22.0% |
| French Canadians | 2.8 /100 | #238 | Tragic 22.2% |
| Malaysians | 2.8 /100 | #239 | Tragic 22.2% |
| French | 2.3 /100 | #240 | Tragic 22.2% |
| Cape Verdeans | 2.1 /100 | #241 | Tragic 22.3% |
| Bermudans | 2.0 /100 | #242 | Tragic 22.3% |
| West Indians | 1.9 /100 | #243 | Tragic 22.3% |
| Immigrants | Middle Africa | 1.9 /100 | #244 | Tragic 22.3% |
| Immigrants | Bangladesh | 1.8 /100 | #245 | Tragic 22.3% |
| Liberians | 1.4 /100 | #246 | Tragic 22.4% |
| Immigrants | El Salvador | 1.4 /100 | #247 | Tragic 22.4% |
| Belizeans | 1.4 /100 | #248 | Tragic 22.4% |
| Immigrants | Caribbean | 1.3 /100 | #249 | Tragic 22.4% |
| Immigrants | Bahamas | 1.2 /100 | #250 | Tragic 22.5% |
Demographics Similar to Immigrants from Russia by Single Female Poverty
In terms of single female poverty, the demographic groups most similar to Immigrants from Russia are Albanian (19.4%, a difference of 0.070%), Immigrants from Sierra Leone (19.4%, a difference of 0.090%), Peruvian (19.4%, a difference of 0.13%), Immigrants from Australia (19.4%, a difference of 0.13%), and Immigrants from Scotland (19.4%, a difference of 0.15%).
| Demographics | Rating | Rank | Single Female Poverty |
| Immigrants | Jordan | 99.4 /100 | #70 | Exceptional 19.3% |
| Immigrants | South Eastern Asia | 99.4 /100 | #71 | Exceptional 19.3% |
| Immigrants | Latvia | 99.4 /100 | #72 | Exceptional 19.3% |
| Immigrants | Peru | 99.4 /100 | #73 | Exceptional 19.3% |
| Immigrants | Belarus | 99.4 /100 | #74 | Exceptional 19.3% |
| Immigrants | Turkey | 99.4 /100 | #75 | Exceptional 19.4% |
| Peruvians | 99.4 /100 | #76 | Exceptional 19.4% |
| Immigrants | Russia | 99.3 /100 | #77 | Exceptional 19.4% |
| Albanians | 99.3 /100 | #78 | Exceptional 19.4% |
| Immigrants | Sierra Leone | 99.3 /100 | #79 | Exceptional 19.4% |
| Immigrants | Australia | 99.3 /100 | #80 | Exceptional 19.4% |
| Immigrants | Scotland | 99.2 /100 | #81 | Exceptional 19.4% |
| Immigrants | Malaysia | 99.2 /100 | #82 | Exceptional 19.4% |
| Taiwanese | 99.2 /100 | #83 | Exceptional 19.4% |
| Immigrants | Sweden | 99.2 /100 | #84 | Exceptional 19.4% |