Arapaho vs Japanese Single Female Poverty
COMPARE
Arapaho
Japanese
Single Female Poverty
Single Female Poverty Comparison
Arapaho
Japanese
26.4%
SINGLE FEMALE POVERTY
0.0/ 100
METRIC RATING
320th/ 347
METRIC RANK
21.3%
SINGLE FEMALE POVERTY
26.4/ 100
METRIC RATING
197th/ 347
METRIC RANK
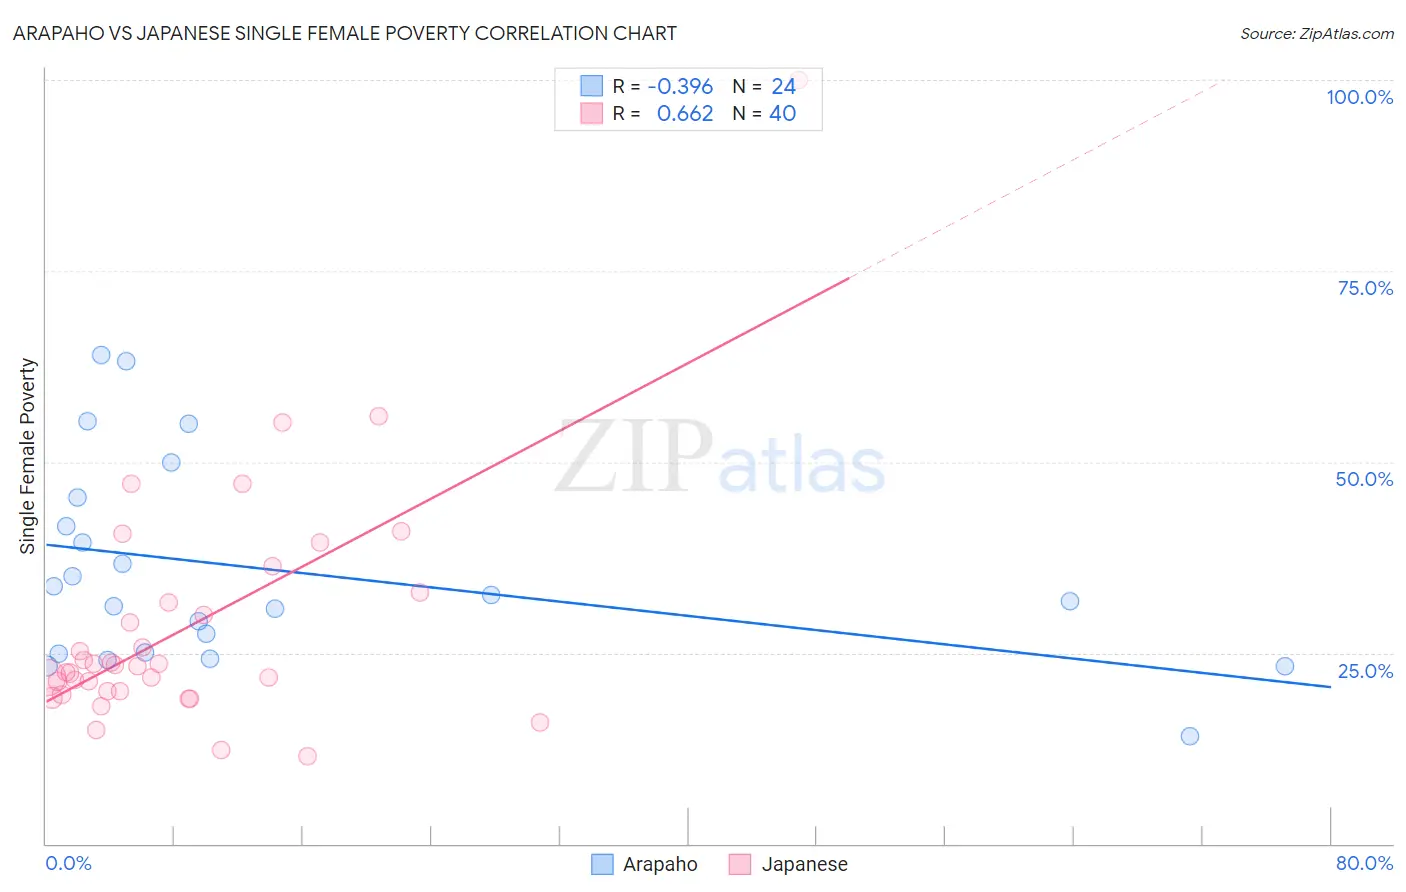
Arapaho vs Japanese Single Female Poverty Correlation Chart
The statistical analysis conducted on geographies consisting of 29,687,271 people shows a mild negative correlation between the proportion of Arapaho and poverty level among single females in the United States with a correlation coefficient (R) of -0.396 and weighted average of 26.4%. Similarly, the statistical analysis conducted on geographies consisting of 247,508,626 people shows a significant positive correlation between the proportion of Japanese and poverty level among single females in the United States with a correlation coefficient (R) of 0.662 and weighted average of 21.3%, a difference of 23.8%.
Single Female Poverty Correlation Summary
| Measurement | Arapaho | Japanese |
| Minimum | 14.1% | 11.5% |
| Maximum | 63.9% | 100.0% |
| Range | 49.8% | 88.5% |
| Mean | 35.9% | 28.5% |
| Median | 32.1% | 23.4% |
| Interquartile 25% (IQ1) | 25.0% | 19.9% |
| Interquartile 75% (IQ3) | 43.4% | 32.3% |
| Interquartile Range (IQR) | 18.5% | 12.3% |
| Standard Deviation (Sample) | 13.4% | 15.9% |
| Standard Deviation (Population) | 13.1% | 15.7% |
Similar Demographics by Single Female Poverty
Demographics Similar to Arapaho by Single Female Poverty
In terms of single female poverty, the demographic groups most similar to Arapaho are Black/African American (26.4%, a difference of 0.30%), Chickasaw (26.3%, a difference of 0.63%), Yup'ik (26.6%, a difference of 0.64%), Seminole (26.8%, a difference of 1.4%), and Chippewa (26.8%, a difference of 1.5%).
| Demographics | Rating | Rank | Single Female Poverty |
| Comanche | 0.0 /100 | #313 | Tragic 25.6% |
| Cherokee | 0.0 /100 | #314 | Tragic 25.7% |
| Iroquois | 0.0 /100 | #315 | Tragic 25.7% |
| Immigrants | Somalia | 0.0 /100 | #316 | Tragic 25.8% |
| Ottawa | 0.0 /100 | #317 | Tragic 26.0% |
| Chickasaw | 0.0 /100 | #318 | Tragic 26.3% |
| Blacks/African Americans | 0.0 /100 | #319 | Tragic 26.4% |
| Arapaho | 0.0 /100 | #320 | Tragic 26.4% |
| Yup'ik | 0.0 /100 | #321 | Tragic 26.6% |
| Seminole | 0.0 /100 | #322 | Tragic 26.8% |
| Chippewa | 0.0 /100 | #323 | Tragic 26.8% |
| Kiowa | 0.0 /100 | #324 | Tragic 26.9% |
| Choctaw | 0.0 /100 | #325 | Tragic 27.2% |
| Creek | 0.0 /100 | #326 | Tragic 27.4% |
| Dutch West Indians | 0.0 /100 | #327 | Tragic 27.5% |
Demographics Similar to Japanese by Single Female Poverty
In terms of single female poverty, the demographic groups most similar to Japanese are Immigrants from Saudi Arabia (21.3%, a difference of 0.060%), Nicaraguan (21.3%, a difference of 0.090%), Czechoslovakian (21.3%, a difference of 0.10%), Basque (21.3%, a difference of 0.13%), and Swiss (21.4%, a difference of 0.17%).
| Demographics | Rating | Rank | Single Female Poverty |
| Trinidadians and Tobagonians | 35.2 /100 | #190 | Fair 21.2% |
| Immigrants | Germany | 31.1 /100 | #191 | Fair 21.3% |
| Immigrants | Jamaica | 30.5 /100 | #192 | Fair 21.3% |
| Basques | 28.1 /100 | #193 | Fair 21.3% |
| Czechoslovakians | 27.7 /100 | #194 | Fair 21.3% |
| Nicaraguans | 27.6 /100 | #195 | Fair 21.3% |
| Immigrants | Saudi Arabia | 27.1 /100 | #196 | Fair 21.3% |
| Japanese | 26.4 /100 | #197 | Fair 21.3% |
| Swiss | 24.2 /100 | #198 | Fair 21.4% |
| Immigrants | Immigrants | 22.0 /100 | #199 | Fair 21.4% |
| Irish | 21.4 /100 | #200 | Fair 21.4% |
| Nigerians | 20.9 /100 | #201 | Fair 21.4% |
| Immigrants | Kenya | 20.7 /100 | #202 | Fair 21.4% |
| Immigrants | Haiti | 18.8 /100 | #203 | Poor 21.5% |
| Immigrants | Africa | 16.7 /100 | #204 | Poor 21.5% |