Arapaho vs Immigrants from Central America Single Female Poverty
COMPARE
Arapaho
Immigrants from Central America
Single Female Poverty
Single Female Poverty Comparison
Arapaho
Immigrants from Central America
26.4%
SINGLE FEMALE POVERTY
0.0/ 100
METRIC RATING
320th/ 347
METRIC RANK
24.8%
SINGLE FEMALE POVERTY
0.0/ 100
METRIC RATING
297th/ 347
METRIC RANK
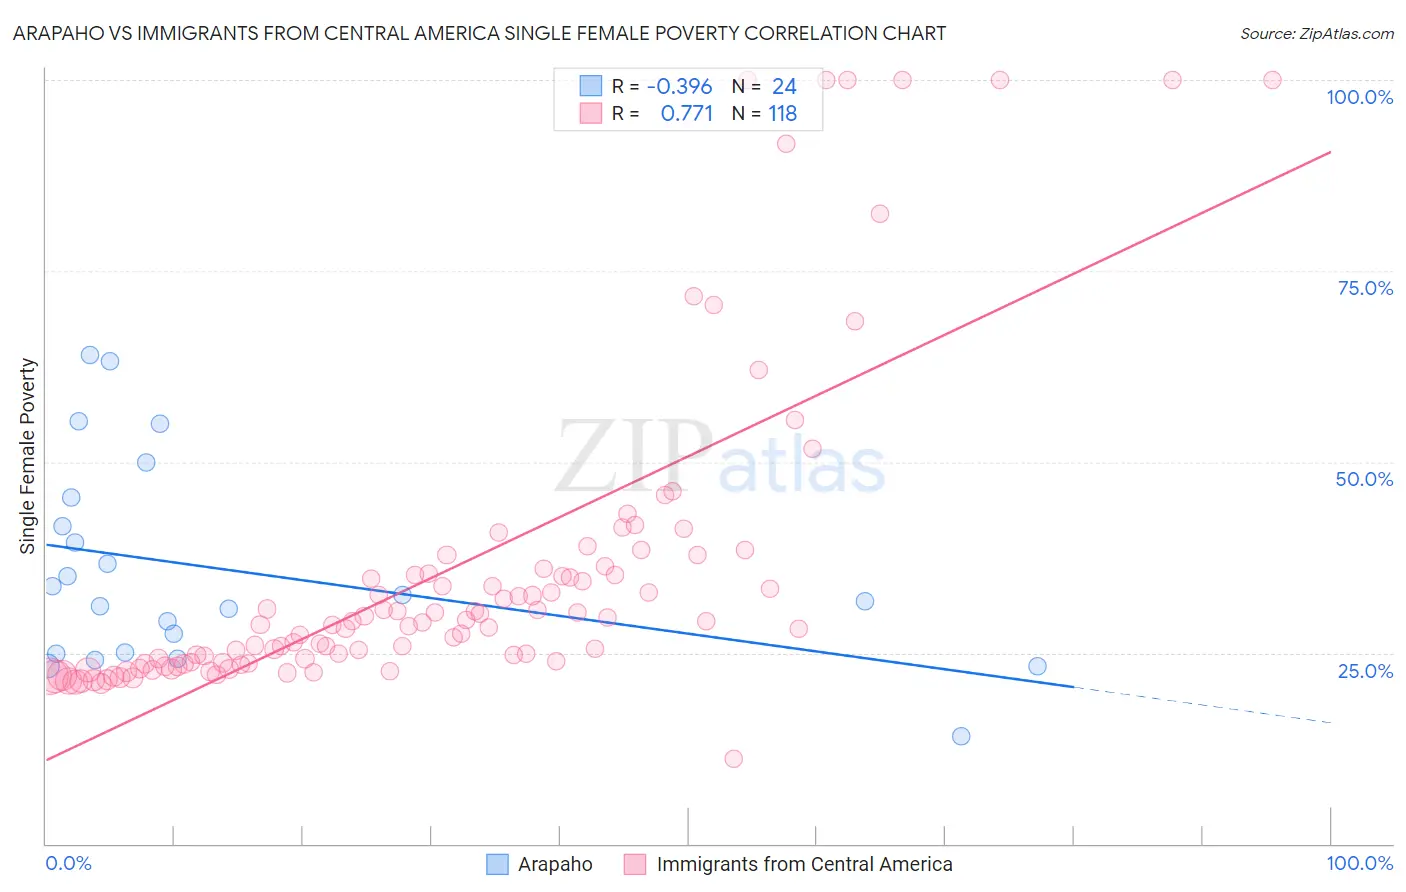
Arapaho vs Immigrants from Central America Single Female Poverty Correlation Chart
The statistical analysis conducted on geographies consisting of 29,687,271 people shows a mild negative correlation between the proportion of Arapaho and poverty level among single females in the United States with a correlation coefficient (R) of -0.396 and weighted average of 26.4%. Similarly, the statistical analysis conducted on geographies consisting of 523,015,170 people shows a strong positive correlation between the proportion of Immigrants from Central America and poverty level among single females in the United States with a correlation coefficient (R) of 0.771 and weighted average of 24.8%, a difference of 6.5%.
Single Female Poverty Correlation Summary
| Measurement | Arapaho | Immigrants from Central America |
| Minimum | 14.1% | 11.1% |
| Maximum | 63.9% | 100.0% |
| Range | 49.8% | 88.9% |
| Mean | 35.9% | 35.5% |
| Median | 32.1% | 28.8% |
| Interquartile 25% (IQ1) | 25.0% | 23.6% |
| Interquartile 75% (IQ3) | 43.4% | 35.4% |
| Interquartile Range (IQR) | 18.5% | 11.8% |
| Standard Deviation (Sample) | 13.4% | 20.4% |
| Standard Deviation (Population) | 13.1% | 20.3% |
Similar Demographics by Single Female Poverty
Demographics Similar to Arapaho by Single Female Poverty
In terms of single female poverty, the demographic groups most similar to Arapaho are Black/African American (26.4%, a difference of 0.30%), Chickasaw (26.3%, a difference of 0.63%), Yup'ik (26.6%, a difference of 0.64%), Seminole (26.8%, a difference of 1.4%), and Chippewa (26.8%, a difference of 1.5%).
| Demographics | Rating | Rank | Single Female Poverty |
| Comanche | 0.0 /100 | #313 | Tragic 25.6% |
| Cherokee | 0.0 /100 | #314 | Tragic 25.7% |
| Iroquois | 0.0 /100 | #315 | Tragic 25.7% |
| Immigrants | Somalia | 0.0 /100 | #316 | Tragic 25.8% |
| Ottawa | 0.0 /100 | #317 | Tragic 26.0% |
| Chickasaw | 0.0 /100 | #318 | Tragic 26.3% |
| Blacks/African Americans | 0.0 /100 | #319 | Tragic 26.4% |
| Arapaho | 0.0 /100 | #320 | Tragic 26.4% |
| Yup'ik | 0.0 /100 | #321 | Tragic 26.6% |
| Seminole | 0.0 /100 | #322 | Tragic 26.8% |
| Chippewa | 0.0 /100 | #323 | Tragic 26.8% |
| Kiowa | 0.0 /100 | #324 | Tragic 26.9% |
| Choctaw | 0.0 /100 | #325 | Tragic 27.2% |
| Creek | 0.0 /100 | #326 | Tragic 27.4% |
| Dutch West Indians | 0.0 /100 | #327 | Tragic 27.5% |
Demographics Similar to Immigrants from Central America by Single Female Poverty
In terms of single female poverty, the demographic groups most similar to Immigrants from Central America are Yaqui (24.9%, a difference of 0.19%), African (24.8%, a difference of 0.28%), Hispanic or Latino (24.6%, a difference of 0.76%), Mexican (25.0%, a difference of 0.86%), and Blackfeet (25.1%, a difference of 0.94%).
| Demographics | Rating | Rank | Single Female Poverty |
| Indonesians | 0.0 /100 | #290 | Tragic 24.3% |
| Osage | 0.0 /100 | #291 | Tragic 24.4% |
| Alsatians | 0.0 /100 | #292 | Tragic 24.5% |
| Americans | 0.0 /100 | #293 | Tragic 24.5% |
| French American Indians | 0.0 /100 | #294 | Tragic 24.6% |
| Hispanics or Latinos | 0.0 /100 | #295 | Tragic 24.6% |
| Africans | 0.0 /100 | #296 | Tragic 24.8% |
| Immigrants | Central America | 0.0 /100 | #297 | Tragic 24.8% |
| Yaqui | 0.0 /100 | #298 | Tragic 24.9% |
| Mexicans | 0.0 /100 | #299 | Tragic 25.0% |
| Blackfeet | 0.0 /100 | #300 | Tragic 25.1% |
| Hondurans | 0.0 /100 | #301 | Tragic 25.1% |
| Shoshone | 0.0 /100 | #302 | Tragic 25.1% |
| Somalis | 0.0 /100 | #303 | Tragic 25.2% |
| Immigrants | Congo | 0.0 /100 | #304 | Tragic 25.3% |