Apache vs Immigrants from Kenya Currently Married
COMPARE
Apache
Immigrants from Kenya
Currently Married
Currently Married Comparison
Apache
Immigrants from Kenya
43.2%
CURRENTLY MARRIED
0.0/ 100
METRIC RATING
280th/ 347
METRIC RANK
44.9%
CURRENTLY MARRIED
1.6/ 100
METRIC RATING
230th/ 347
METRIC RANK
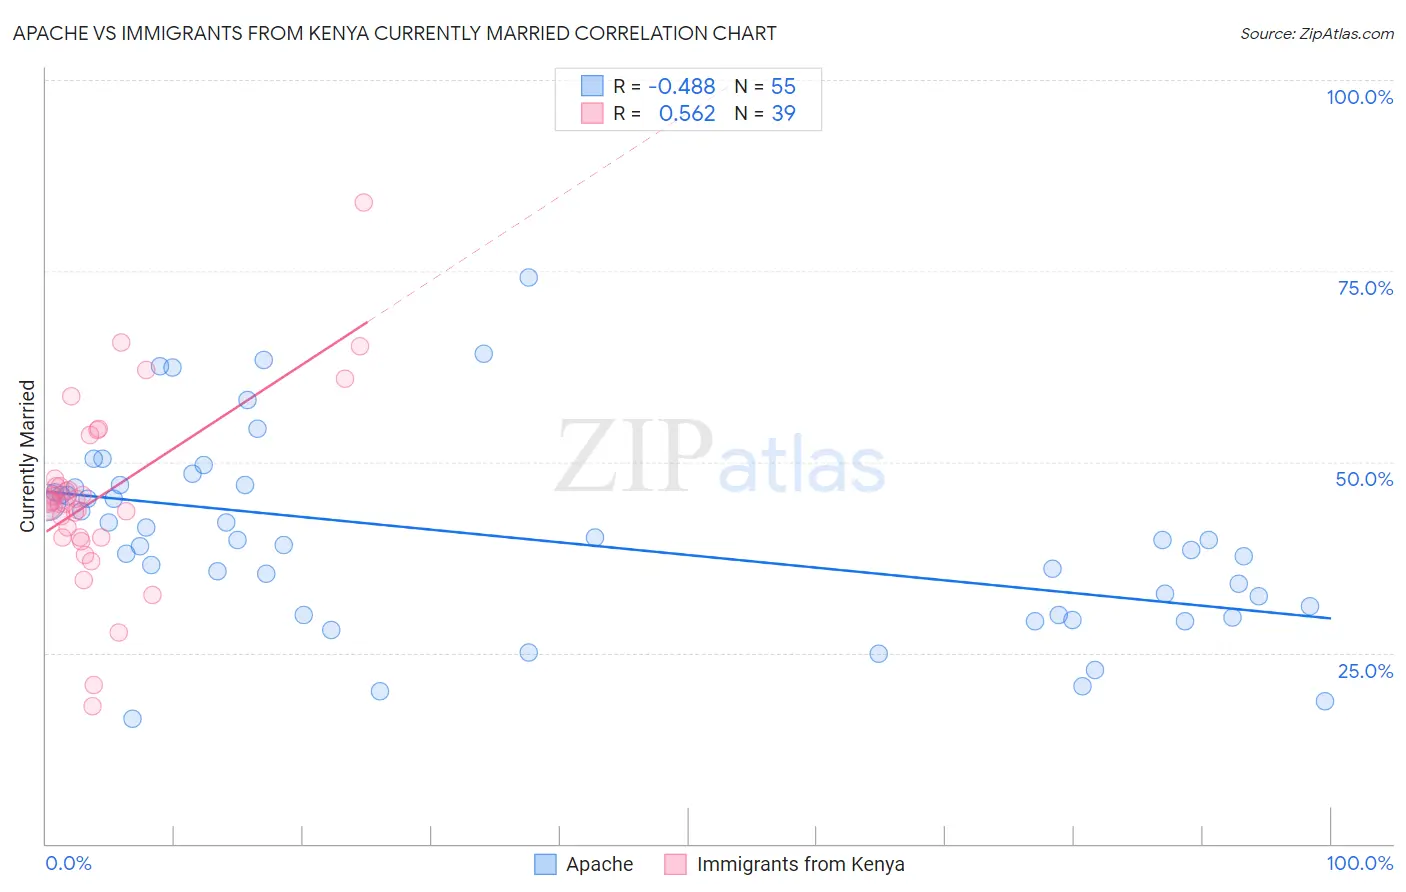
Apache vs Immigrants from Kenya Currently Married Correlation Chart
The statistical analysis conducted on geographies consisting of 231,125,444 people shows a moderate negative correlation between the proportion of Apache and percentage of population currently married in the United States with a correlation coefficient (R) of -0.488 and weighted average of 43.2%. Similarly, the statistical analysis conducted on geographies consisting of 218,071,157 people shows a substantial positive correlation between the proportion of Immigrants from Kenya and percentage of population currently married in the United States with a correlation coefficient (R) of 0.562 and weighted average of 44.9%, a difference of 3.8%.
Currently Married Correlation Summary
| Measurement | Apache | Immigrants from Kenya |
| Minimum | 16.3% | 18.0% |
| Maximum | 74.2% | 83.9% |
| Range | 57.9% | 65.9% |
| Mean | 40.0% | 45.6% |
| Median | 39.7% | 44.8% |
| Interquartile 25% (IQ1) | 30.0% | 40.1% |
| Interquartile 75% (IQ3) | 46.7% | 47.8% |
| Interquartile Range (IQR) | 16.7% | 7.8% |
| Standard Deviation (Sample) | 12.3% | 12.0% |
| Standard Deviation (Population) | 12.2% | 11.8% |
Similar Demographics by Currently Married
Demographics Similar to Apache by Currently Married
In terms of currently married, the demographic groups most similar to Apache are Chippewa (43.2%, a difference of 0.010%), Central American Indian (43.3%, a difference of 0.080%), Immigrants from Ecuador (43.2%, a difference of 0.080%), Kiowa (43.2%, a difference of 0.19%), and Immigrants from El Salvador (43.1%, a difference of 0.20%).
| Demographics | Rating | Rank | Currently Married |
| Yaqui | 0.1 /100 | #273 | Tragic 43.4% |
| Nigerians | 0.1 /100 | #274 | Tragic 43.4% |
| Colville | 0.1 /100 | #275 | Tragic 43.4% |
| Sierra Leoneans | 0.1 /100 | #276 | Tragic 43.4% |
| Immigrants | Nigeria | 0.1 /100 | #277 | Tragic 43.4% |
| Central Americans | 0.0 /100 | #278 | Tragic 43.3% |
| Central American Indians | 0.0 /100 | #279 | Tragic 43.3% |
| Apache | 0.0 /100 | #280 | Tragic 43.2% |
| Chippewa | 0.0 /100 | #281 | Tragic 43.2% |
| Immigrants | Ecuador | 0.0 /100 | #282 | Tragic 43.2% |
| Kiowa | 0.0 /100 | #283 | Tragic 43.2% |
| Immigrants | El Salvador | 0.0 /100 | #284 | Tragic 43.1% |
| Immigrants | Middle Africa | 0.0 /100 | #285 | Tragic 43.0% |
| Ghanaians | 0.0 /100 | #286 | Tragic 42.9% |
| Guatemalans | 0.0 /100 | #287 | Tragic 42.9% |
Demographics Similar to Immigrants from Kenya by Currently Married
In terms of currently married, the demographic groups most similar to Immigrants from Kenya are Cree (44.9%, a difference of 0.040%), Immigrants from Panama (44.9%, a difference of 0.040%), Immigrants from Uruguay (45.0%, a difference of 0.23%), Comanche (45.0%, a difference of 0.24%), and Spanish American (45.0%, a difference of 0.24%).
| Demographics | Rating | Rank | Currently Married |
| Immigrants | Laos | 2.3 /100 | #223 | Tragic 45.0% |
| Immigrants | Uganda | 2.2 /100 | #224 | Tragic 45.0% |
| French American Indians | 2.2 /100 | #225 | Tragic 45.0% |
| Comanche | 2.1 /100 | #226 | Tragic 45.0% |
| Spanish Americans | 2.1 /100 | #227 | Tragic 45.0% |
| Immigrants | Uruguay | 2.0 /100 | #228 | Tragic 45.0% |
| Cree | 1.7 /100 | #229 | Tragic 44.9% |
| Immigrants | Kenya | 1.6 /100 | #230 | Tragic 44.9% |
| Immigrants | Panama | 1.5 /100 | #231 | Tragic 44.9% |
| Nepalese | 1.2 /100 | #232 | Tragic 44.7% |
| Immigrants | Saudi Arabia | 1.1 /100 | #233 | Tragic 44.7% |
| Iroquois | 1.1 /100 | #234 | Tragic 44.7% |
| Alaskan Athabascans | 0.9 /100 | #235 | Tragic 44.6% |
| Cubans | 0.9 /100 | #236 | Tragic 44.6% |
| Seminole | 0.9 /100 | #237 | Tragic 44.6% |