Apache vs Immigrants from Kenya Median Female Earnings
COMPARE
Apache
Immigrants from Kenya
Median Female Earnings
Median Female Earnings Comparison
Apache
Immigrants from Kenya
$34,895
MEDIAN FEMALE EARNINGS
0.0/ 100
METRIC RATING
314th/ 347
METRIC RANK
$39,535
MEDIAN FEMALE EARNINGS
41.6/ 100
METRIC RATING
180th/ 347
METRIC RANK
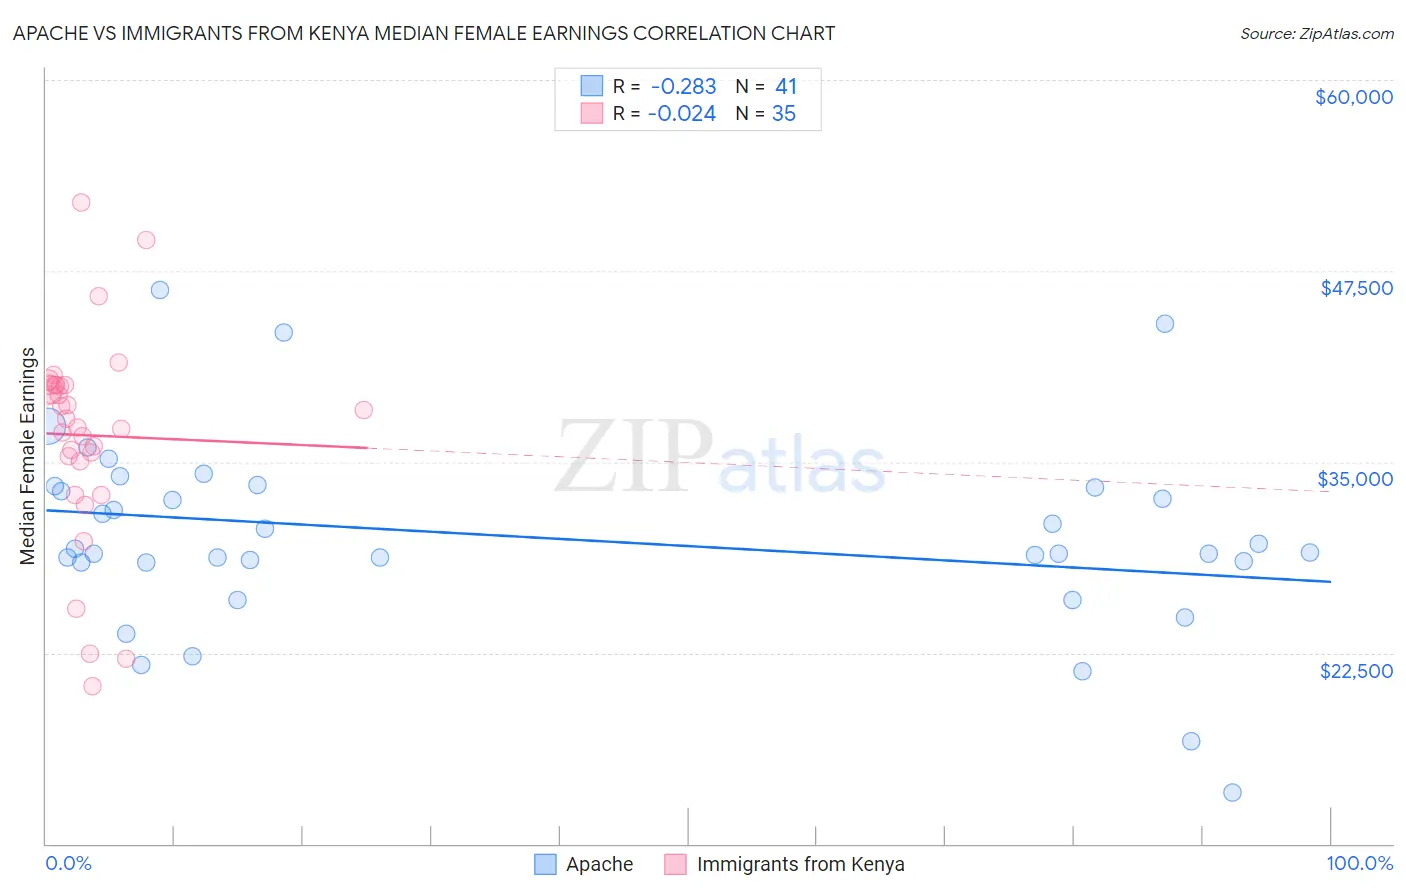
Apache vs Immigrants from Kenya Median Female Earnings Correlation Chart
The statistical analysis conducted on geographies consisting of 230,997,872 people shows a weak negative correlation between the proportion of Apache and median female earnings in the United States with a correlation coefficient (R) of -0.283 and weighted average of $34,895. Similarly, the statistical analysis conducted on geographies consisting of 218,064,981 people shows no correlation between the proportion of Immigrants from Kenya and median female earnings in the United States with a correlation coefficient (R) of -0.024 and weighted average of $39,535, a difference of 13.3%.
Median Female Earnings Correlation Summary
| Measurement | Apache | Immigrants from Kenya |
| Minimum | $13,381 | $20,281 |
| Maximum | $46,250 | $51,989 |
| Range | $32,869 | $31,708 |
| Mean | $30,090 | $36,741 |
| Median | $29,044 | $37,816 |
| Interquartile 25% (IQ1) | $28,433 | $35,077 |
| Interquartile 75% (IQ3) | $33,369 | $40,014 |
| Interquartile Range (IQR) | $4,936 | $4,937 |
| Standard Deviation (Sample) | $6,387 | $6,740 |
| Standard Deviation (Population) | $6,309 | $6,643 |
Similar Demographics by Median Female Earnings
Demographics Similar to Apache by Median Female Earnings
In terms of median female earnings, the demographic groups most similar to Apache are Cuban ($34,942, a difference of 0.13%), Yaqui ($34,943, a difference of 0.14%), Ute ($34,960, a difference of 0.19%), Pennsylvania German ($34,802, a difference of 0.27%), and Chippewa ($35,003, a difference of 0.31%).
| Demographics | Rating | Rank | Median Female Earnings |
| Sioux | 0.0 /100 | #307 | Tragic $35,063 |
| Immigrants | Bahamas | 0.0 /100 | #308 | Tragic $35,027 |
| Hondurans | 0.0 /100 | #309 | Tragic $35,013 |
| Chippewa | 0.0 /100 | #310 | Tragic $35,003 |
| Ute | 0.0 /100 | #311 | Tragic $34,960 |
| Yaqui | 0.0 /100 | #312 | Tragic $34,943 |
| Cubans | 0.0 /100 | #313 | Tragic $34,942 |
| Apache | 0.0 /100 | #314 | Tragic $34,895 |
| Pennsylvania Germans | 0.0 /100 | #315 | Tragic $34,802 |
| Cherokee | 0.0 /100 | #316 | Tragic $34,742 |
| Potawatomi | 0.0 /100 | #317 | Tragic $34,739 |
| Immigrants | Yemen | 0.0 /100 | #318 | Tragic $34,693 |
| Shoshone | 0.0 /100 | #319 | Tragic $34,677 |
| Immigrants | Honduras | 0.0 /100 | #320 | Tragic $34,647 |
| Hispanics or Latinos | 0.0 /100 | #321 | Tragic $34,421 |
Demographics Similar to Immigrants from Kenya by Median Female Earnings
In terms of median female earnings, the demographic groups most similar to Immigrants from Kenya are Tsimshian ($39,530, a difference of 0.010%), Tlingit-Haida ($39,513, a difference of 0.060%), Hungarian ($39,510, a difference of 0.060%), Immigrants from Germany ($39,603, a difference of 0.17%), and Slavic ($39,613, a difference of 0.20%).
| Demographics | Rating | Rank | Median Female Earnings |
| Canadians | 51.4 /100 | #173 | Average $39,724 |
| South Americans | 50.0 /100 | #174 | Average $39,698 |
| Immigrants | South America | 47.2 /100 | #175 | Average $39,643 |
| Nigerians | 47.0 /100 | #176 | Average $39,641 |
| Costa Ricans | 46.1 /100 | #177 | Average $39,622 |
| Slavs | 45.6 /100 | #178 | Average $39,613 |
| Immigrants | Germany | 45.1 /100 | #179 | Average $39,603 |
| Immigrants | Kenya | 41.6 /100 | #180 | Average $39,535 |
| Tsimshian | 41.4 /100 | #181 | Average $39,530 |
| Tlingit-Haida | 40.5 /100 | #182 | Average $39,513 |
| Hungarians | 40.3 /100 | #183 | Average $39,510 |
| Europeans | 37.7 /100 | #184 | Fair $39,457 |
| Immigrants | West Indies | 36.9 /100 | #185 | Fair $39,441 |
| Colombians | 36.9 /100 | #186 | Fair $39,439 |
| Swedes | 36.0 /100 | #187 | Fair $39,421 |