Apache vs Immigrants from Hungary 4th Grade
COMPARE
Apache
Immigrants from Hungary
4th Grade
4th Grade Comparison
Apache
Immigrants from Hungary
97.6%
4TH GRADE
61.3/ 100
METRIC RATING
160th/ 347
METRIC RANK
97.7%
4TH GRADE
89.3/ 100
METRIC RATING
132nd/ 347
METRIC RANK
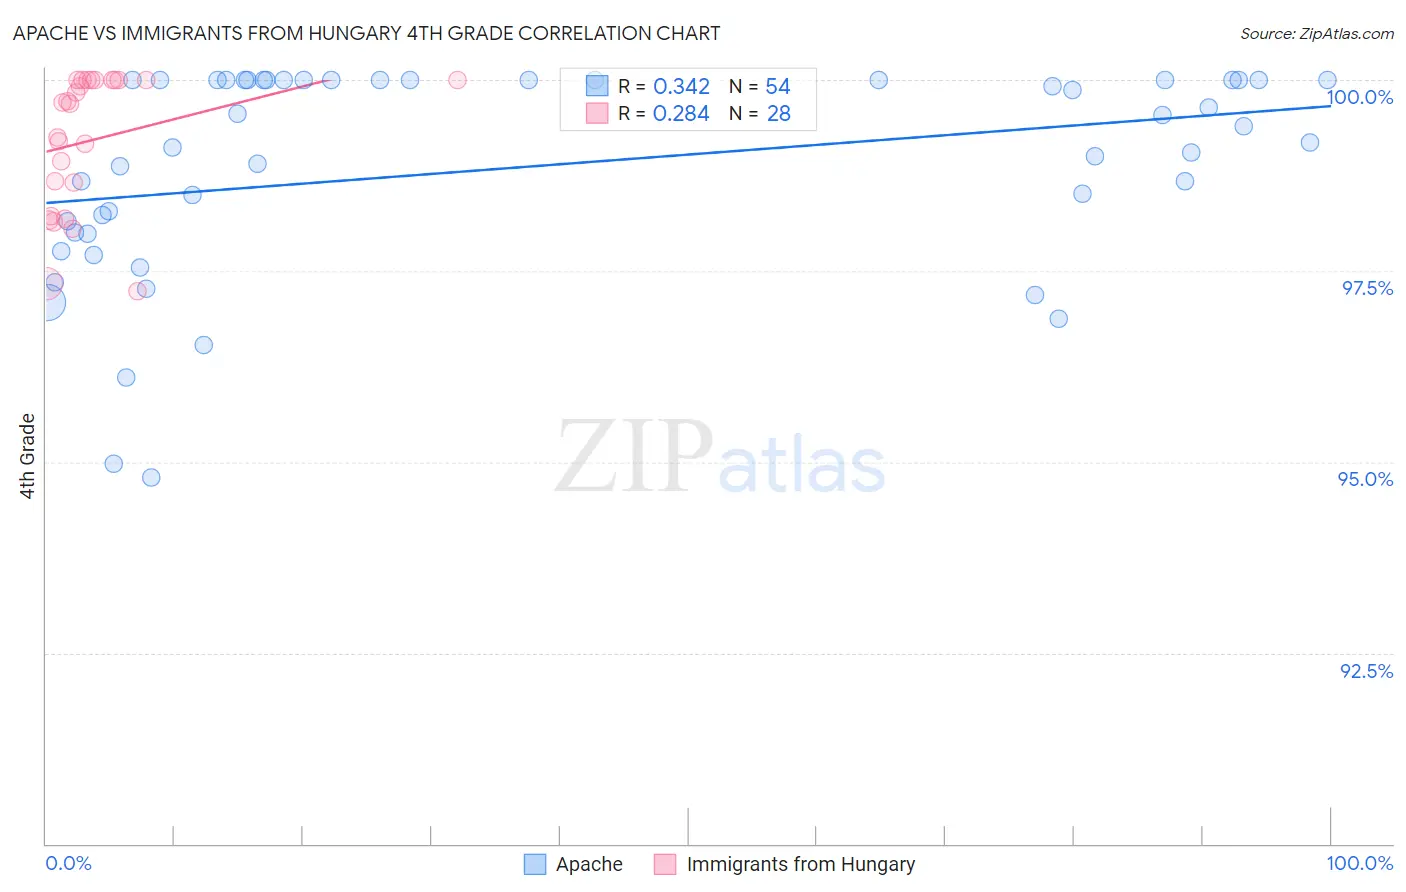
Apache vs Immigrants from Hungary 4th Grade Correlation Chart
The statistical analysis conducted on geographies consisting of 231,142,814 people shows a mild positive correlation between the proportion of Apache and percentage of population with at least 4th grade education in the United States with a correlation coefficient (R) of 0.342 and weighted average of 97.6%. Similarly, the statistical analysis conducted on geographies consisting of 195,707,305 people shows a weak positive correlation between the proportion of Immigrants from Hungary and percentage of population with at least 4th grade education in the United States with a correlation coefficient (R) of 0.284 and weighted average of 97.7%, a difference of 0.16%.
4th Grade Correlation Summary
| Measurement | Apache | Immigrants from Hungary |
| Minimum | 94.8% | 97.2% |
| Maximum | 100.0% | 100.0% |
| Range | 5.2% | 2.8% |
| Mean | 98.9% | 99.2% |
| Median | 99.3% | 99.7% |
| Interquartile 25% (IQ1) | 98.0% | 98.4% |
| Interquartile 75% (IQ3) | 100.0% | 100.0% |
| Interquartile Range (IQR) | 2.0% | 1.6% |
| Standard Deviation (Sample) | 1.4% | 0.89% |
| Standard Deviation (Population) | 1.3% | 0.88% |
Similar Demographics by 4th Grade
Demographics Similar to Apache by 4th Grade
In terms of 4th grade, the demographic groups most similar to Apache are Marshallese (97.6%, a difference of 0.0%), Bermudan (97.6%, a difference of 0.0%), Immigrants from Iran (97.6%, a difference of 0.0%), Immigrants from Italy (97.6%, a difference of 0.010%), and Ugandan (97.6%, a difference of 0.010%).
| Demographics | Rating | Rank | 4th Grade |
| Immigrants | Eastern Europe | 71.3 /100 | #153 | Good 97.6% |
| Immigrants | Russia | 67.0 /100 | #154 | Good 97.6% |
| Albanians | 67.0 /100 | #155 | Good 97.6% |
| Immigrants | Jordan | 66.9 /100 | #156 | Good 97.6% |
| Immigrants | Bosnia and Herzegovina | 66.0 /100 | #157 | Good 97.6% |
| French American Indians | 65.9 /100 | #158 | Good 97.6% |
| Immigrants | Italy | 63.7 /100 | #159 | Good 97.6% |
| Apache | 61.3 /100 | #160 | Good 97.6% |
| Marshallese | 60.8 /100 | #161 | Good 97.6% |
| Bermudans | 60.5 /100 | #162 | Good 97.6% |
| Immigrants | Iran | 60.3 /100 | #163 | Good 97.6% |
| Ugandans | 58.9 /100 | #164 | Average 97.6% |
| Venezuelans | 58.7 /100 | #165 | Average 97.6% |
| Kenyans | 56.5 /100 | #166 | Average 97.5% |
| Immigrants | Poland | 55.9 /100 | #167 | Average 97.5% |
Demographics Similar to Immigrants from Hungary by 4th Grade
In terms of 4th grade, the demographic groups most similar to Immigrants from Hungary are Immigrants from Kuwait (97.7%, a difference of 0.0%), Immigrants from Romania (97.7%, a difference of 0.010%), Hmong (97.7%, a difference of 0.010%), Palestinian (97.7%, a difference of 0.010%), and Cambodian (97.7%, a difference of 0.010%).
| Demographics | Rating | Rank | 4th Grade |
| Immigrants | Serbia | 92.6 /100 | #125 | Exceptional 97.8% |
| Immigrants | Europe | 92.5 /100 | #126 | Exceptional 97.8% |
| Colville | 92.3 /100 | #127 | Exceptional 97.7% |
| Pima | 92.0 /100 | #128 | Exceptional 97.7% |
| Immigrants | Bulgaria | 91.3 /100 | #129 | Exceptional 97.7% |
| Immigrants | Romania | 90.6 /100 | #130 | Exceptional 97.7% |
| Immigrants | Kuwait | 89.7 /100 | #131 | Excellent 97.7% |
| Immigrants | Hungary | 89.3 /100 | #132 | Excellent 97.7% |
| Hmong | 88.2 /100 | #133 | Excellent 97.7% |
| Palestinians | 88.1 /100 | #134 | Excellent 97.7% |
| Cambodians | 87.8 /100 | #135 | Excellent 97.7% |
| Israelis | 86.2 /100 | #136 | Excellent 97.7% |
| Immigrants | Turkey | 86.0 /100 | #137 | Excellent 97.7% |
| Blackfeet | 86.0 /100 | #138 | Excellent 97.7% |
| Seminole | 84.7 /100 | #139 | Excellent 97.7% |