Taiwanese vs Immigrants from Hungary Receiving Food Stamps
COMPARE
Taiwanese
Immigrants from Hungary
Receiving Food Stamps
Receiving Food Stamps Comparison
Taiwanese
Immigrants from Hungary
11.0%
RECEIVING FOOD STAMPS
84.2/ 100
METRIC RATING
146th/ 347
METRIC RANK
10.3%
RECEIVING FOOD STAMPS
96.7/ 100
METRIC RATING
104th/ 347
METRIC RANK
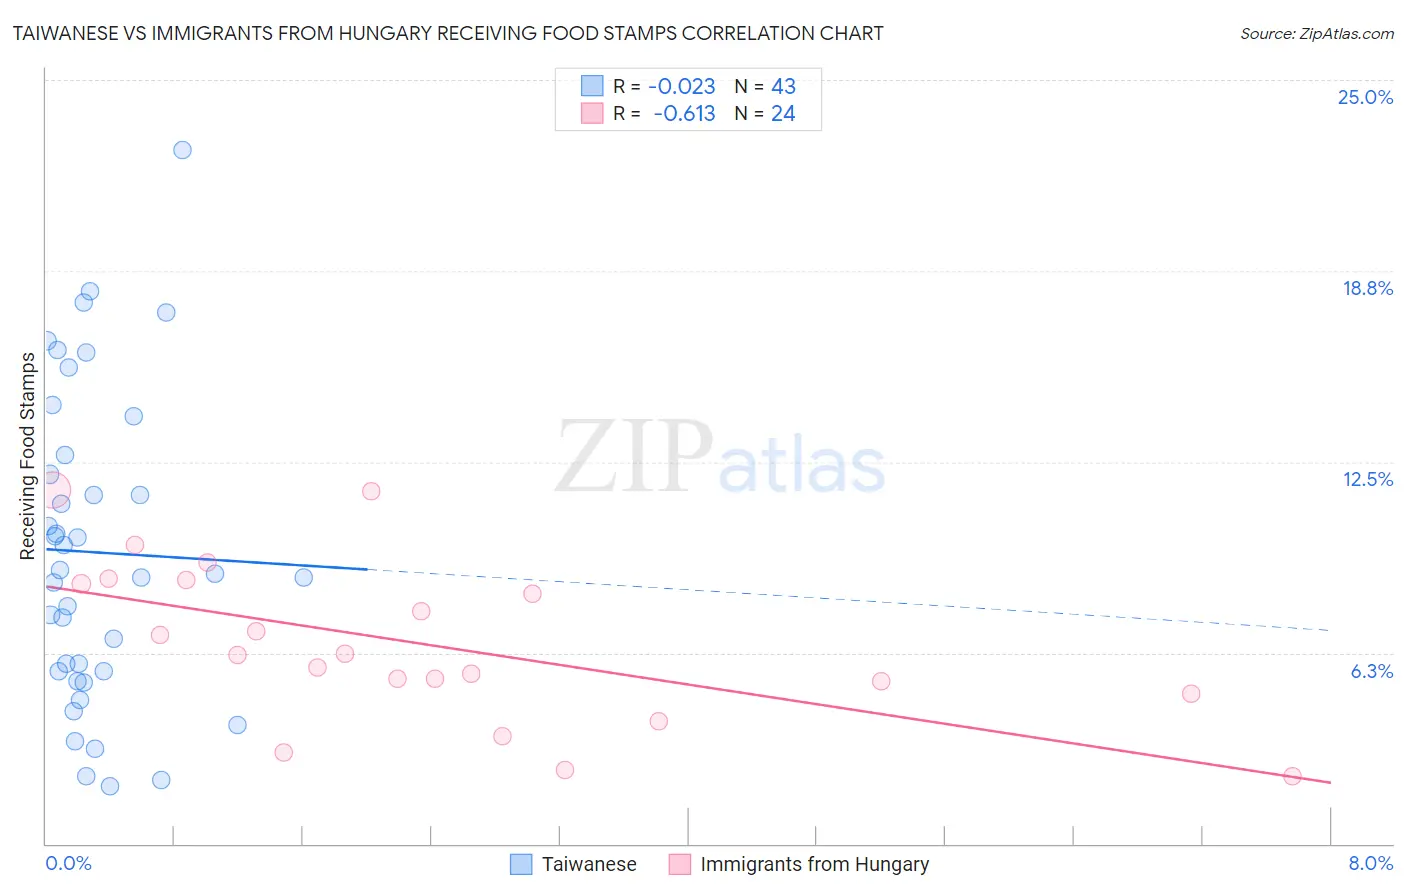
Taiwanese vs Immigrants from Hungary Receiving Food Stamps Correlation Chart
The statistical analysis conducted on geographies consisting of 31,675,875 people shows no correlation between the proportion of Taiwanese and percentage of population receiving government assistance and/or food stamps in the United States with a correlation coefficient (R) of -0.023 and weighted average of 11.0%. Similarly, the statistical analysis conducted on geographies consisting of 195,389,493 people shows a significant negative correlation between the proportion of Immigrants from Hungary and percentage of population receiving government assistance and/or food stamps in the United States with a correlation coefficient (R) of -0.613 and weighted average of 10.3%, a difference of 6.8%.
Receiving Food Stamps Correlation Summary
| Measurement | Taiwanese | Immigrants from Hungary |
| Minimum | 1.9% | 2.2% |
| Maximum | 22.7% | 11.6% |
| Range | 20.8% | 9.4% |
| Mean | 9.5% | 6.6% |
| Median | 8.8% | 6.2% |
| Interquartile 25% (IQ1) | 5.6% | 5.1% |
| Interquartile 75% (IQ3) | 12.7% | 8.6% |
| Interquartile Range (IQR) | 7.1% | 3.5% |
| Standard Deviation (Sample) | 5.0% | 2.6% |
| Standard Deviation (Population) | 5.0% | 2.6% |
Similar Demographics by Receiving Food Stamps
Demographics Similar to Taiwanese by Receiving Food Stamps
In terms of receiving food stamps, the demographic groups most similar to Taiwanese are White/Caucasian (11.1%, a difference of 0.090%), Hungarian (11.0%, a difference of 0.24%), Immigrants from South Eastern Asia (11.1%, a difference of 0.26%), Brazilian (11.1%, a difference of 0.28%), and Soviet Union (11.1%, a difference of 0.30%).
| Demographics | Rating | Rank | Receiving Food Stamps |
| Hmong | 88.4 /100 | #139 | Excellent 10.9% |
| Celtics | 87.8 /100 | #140 | Excellent 10.9% |
| Immigrants | Vietnam | 86.7 /100 | #141 | Excellent 11.0% |
| Chileans | 86.2 /100 | #142 | Excellent 11.0% |
| Immigrants | Northern Africa | 86.0 /100 | #143 | Excellent 11.0% |
| Syrians | 85.5 /100 | #144 | Excellent 11.0% |
| Hungarians | 85.1 /100 | #145 | Excellent 11.0% |
| Taiwanese | 84.2 /100 | #146 | Excellent 11.0% |
| Whites/Caucasians | 83.9 /100 | #147 | Excellent 11.1% |
| Immigrants | South Eastern Asia | 83.3 /100 | #148 | Excellent 11.1% |
| Brazilians | 83.2 /100 | #149 | Excellent 11.1% |
| Soviet Union | 83.1 /100 | #150 | Excellent 11.1% |
| Immigrants | Spain | 81.7 /100 | #151 | Excellent 11.1% |
| Immigrants | Kazakhstan | 81.7 /100 | #152 | Excellent 11.1% |
| Lebanese | 81.6 /100 | #153 | Excellent 11.1% |
Demographics Similar to Immigrants from Hungary by Receiving Food Stamps
In terms of receiving food stamps, the demographic groups most similar to Immigrants from Hungary are Immigrants from Latvia (10.3%, a difference of 0.010%), Immigrants from Europe (10.3%, a difference of 0.11%), Palestinian (10.3%, a difference of 0.19%), Immigrants from Western Europe (10.3%, a difference of 0.20%), and Serbian (10.3%, a difference of 0.32%).
| Demographics | Rating | Rank | Receiving Food Stamps |
| Czechoslovakians | 97.2 /100 | #97 | Exceptional 10.3% |
| Immigrants | Egypt | 97.1 /100 | #98 | Exceptional 10.3% |
| Serbians | 97.0 /100 | #99 | Exceptional 10.3% |
| Immigrants | Western Europe | 96.9 /100 | #100 | Exceptional 10.3% |
| Palestinians | 96.9 /100 | #101 | Exceptional 10.3% |
| Immigrants | Europe | 96.8 /100 | #102 | Exceptional 10.3% |
| Immigrants | Latvia | 96.8 /100 | #103 | Exceptional 10.3% |
| Immigrants | Hungary | 96.7 /100 | #104 | Exceptional 10.3% |
| Immigrants | Malaysia | 96.5 /100 | #105 | Exceptional 10.4% |
| Immigrants | Italy | 96.4 /100 | #106 | Exceptional 10.4% |
| Koreans | 96.3 /100 | #107 | Exceptional 10.4% |
| Carpatho Rusyns | 96.2 /100 | #108 | Exceptional 10.4% |
| Immigrants | Pakistan | 96.2 /100 | #109 | Exceptional 10.4% |
| Pakistanis | 95.9 /100 | #110 | Exceptional 10.4% |
| Romanians | 95.8 /100 | #111 | Exceptional 10.4% |