Immigrants from Peru vs Immigrants from Hungary Receiving Food Stamps
COMPARE
Immigrants from Peru
Immigrants from Hungary
Receiving Food Stamps
Receiving Food Stamps Comparison
Immigrants from Peru
Immigrants from Hungary
12.0%
RECEIVING FOOD STAMPS
32.2/ 100
METRIC RATING
190th/ 347
METRIC RANK
10.3%
RECEIVING FOOD STAMPS
96.7/ 100
METRIC RATING
104th/ 347
METRIC RANK
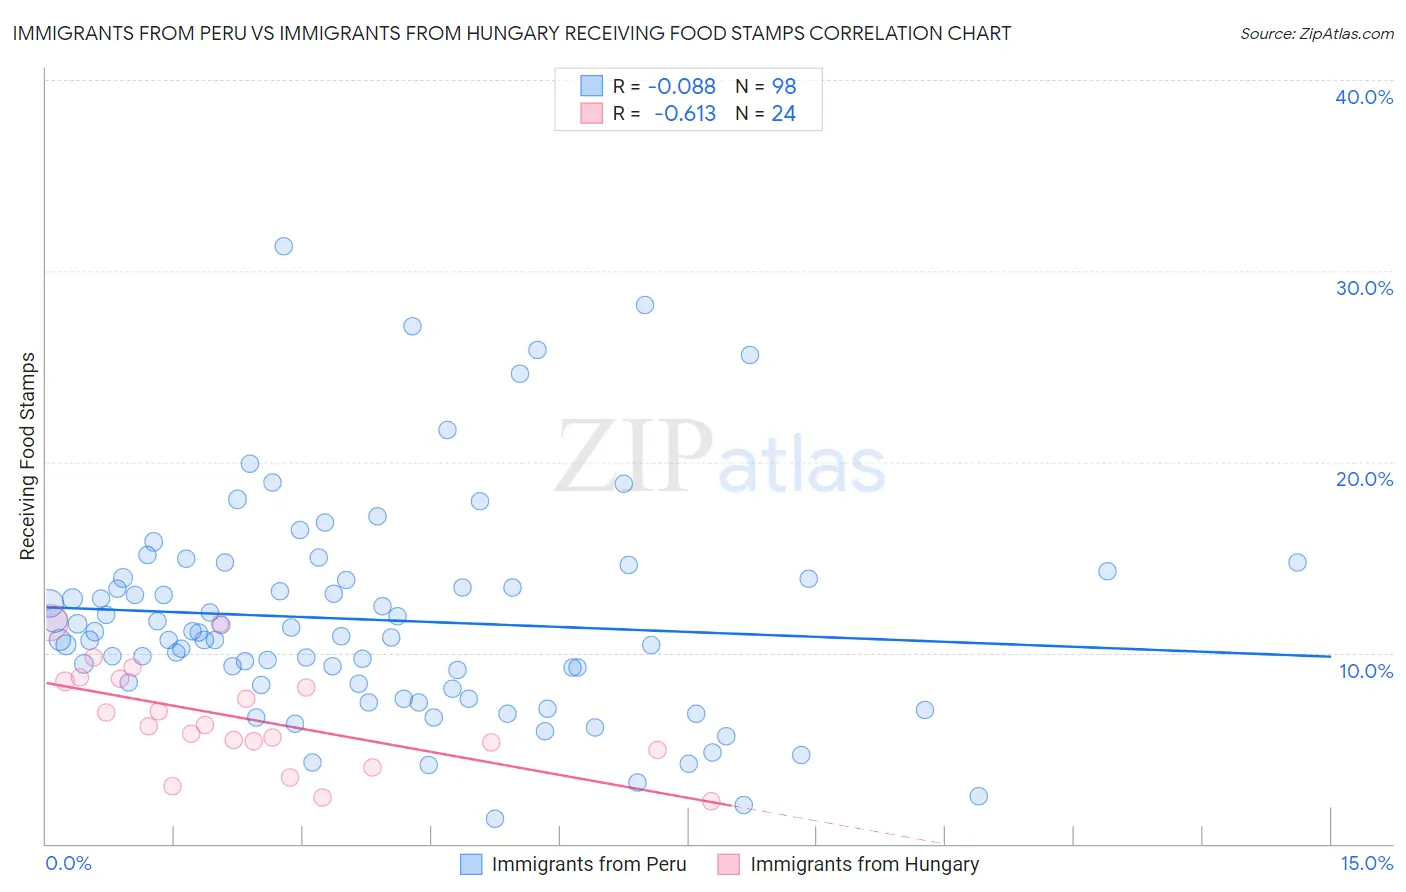
Immigrants from Peru vs Immigrants from Hungary Receiving Food Stamps Correlation Chart
The statistical analysis conducted on geographies consisting of 328,237,841 people shows a slight negative correlation between the proportion of Immigrants from Peru and percentage of population receiving government assistance and/or food stamps in the United States with a correlation coefficient (R) of -0.088 and weighted average of 12.0%. Similarly, the statistical analysis conducted on geographies consisting of 195,389,493 people shows a significant negative correlation between the proportion of Immigrants from Hungary and percentage of population receiving government assistance and/or food stamps in the United States with a correlation coefficient (R) of -0.613 and weighted average of 10.3%, a difference of 16.4%.
Receiving Food Stamps Correlation Summary
| Measurement | Immigrants from Peru | Immigrants from Hungary |
| Minimum | 1.3% | 2.2% |
| Maximum | 31.3% | 11.6% |
| Range | 30.0% | 9.4% |
| Mean | 11.7% | 6.6% |
| Median | 10.8% | 6.2% |
| Interquartile 25% (IQ1) | 8.3% | 5.1% |
| Interquartile 75% (IQ3) | 13.9% | 8.6% |
| Interquartile Range (IQR) | 5.6% | 3.5% |
| Standard Deviation (Sample) | 5.6% | 2.6% |
| Standard Deviation (Population) | 5.6% | 2.6% |
Similar Demographics by Receiving Food Stamps
Demographics Similar to Immigrants from Peru by Receiving Food Stamps
In terms of receiving food stamps, the demographic groups most similar to Immigrants from Peru are Venezuelan (12.0%, a difference of 0.010%), Immigrants from Cameroon (12.0%, a difference of 0.060%), Samoan (12.1%, a difference of 0.19%), Sudanese (12.0%, a difference of 0.20%), and Albanian (12.0%, a difference of 0.50%).
| Demographics | Rating | Rank | Receiving Food Stamps |
| Immigrants | Uganda | 40.3 /100 | #183 | Average 11.9% |
| Spaniards | 39.8 /100 | #184 | Fair 11.9% |
| Immigrants | Iraq | 37.1 /100 | #185 | Fair 12.0% |
| Spanish | 36.9 /100 | #186 | Fair 12.0% |
| Albanians | 35.4 /100 | #187 | Fair 12.0% |
| Sudanese | 33.4 /100 | #188 | Fair 12.0% |
| Immigrants | Cameroon | 32.5 /100 | #189 | Fair 12.0% |
| Immigrants | Peru | 32.2 /100 | #190 | Fair 12.0% |
| Venezuelans | 32.1 /100 | #191 | Fair 12.0% |
| Samoans | 31.0 /100 | #192 | Fair 12.1% |
| Immigrants | Fiji | 27.8 /100 | #193 | Fair 12.1% |
| Immigrants | Sudan | 27.1 /100 | #194 | Fair 12.1% |
| Americans | 26.7 /100 | #195 | Fair 12.2% |
| Iraqis | 26.6 /100 | #196 | Fair 12.2% |
| Delaware | 26.1 /100 | #197 | Fair 12.2% |
Demographics Similar to Immigrants from Hungary by Receiving Food Stamps
In terms of receiving food stamps, the demographic groups most similar to Immigrants from Hungary are Immigrants from Latvia (10.3%, a difference of 0.010%), Immigrants from Europe (10.3%, a difference of 0.11%), Palestinian (10.3%, a difference of 0.19%), Immigrants from Western Europe (10.3%, a difference of 0.20%), and Serbian (10.3%, a difference of 0.32%).
| Demographics | Rating | Rank | Receiving Food Stamps |
| Czechoslovakians | 97.2 /100 | #97 | Exceptional 10.3% |
| Immigrants | Egypt | 97.1 /100 | #98 | Exceptional 10.3% |
| Serbians | 97.0 /100 | #99 | Exceptional 10.3% |
| Immigrants | Western Europe | 96.9 /100 | #100 | Exceptional 10.3% |
| Palestinians | 96.9 /100 | #101 | Exceptional 10.3% |
| Immigrants | Europe | 96.8 /100 | #102 | Exceptional 10.3% |
| Immigrants | Latvia | 96.8 /100 | #103 | Exceptional 10.3% |
| Immigrants | Hungary | 96.7 /100 | #104 | Exceptional 10.3% |
| Immigrants | Malaysia | 96.5 /100 | #105 | Exceptional 10.4% |
| Immigrants | Italy | 96.4 /100 | #106 | Exceptional 10.4% |
| Koreans | 96.3 /100 | #107 | Exceptional 10.4% |
| Carpatho Rusyns | 96.2 /100 | #108 | Exceptional 10.4% |
| Immigrants | Pakistan | 96.2 /100 | #109 | Exceptional 10.4% |
| Pakistanis | 95.9 /100 | #110 | Exceptional 10.4% |
| Romanians | 95.8 /100 | #111 | Exceptional 10.4% |