Australian vs Immigrants from Barbados Receiving Food Stamps
COMPARE
Australian
Immigrants from Barbados
Receiving Food Stamps
Receiving Food Stamps Comparison
Australians
Immigrants from Barbados
9.6%
RECEIVING FOOD STAMPS
99.4/ 100
METRIC RATING
46th/ 347
METRIC RANK
16.6%
RECEIVING FOOD STAMPS
0.0/ 100
METRIC RATING
310th/ 347
METRIC RANK
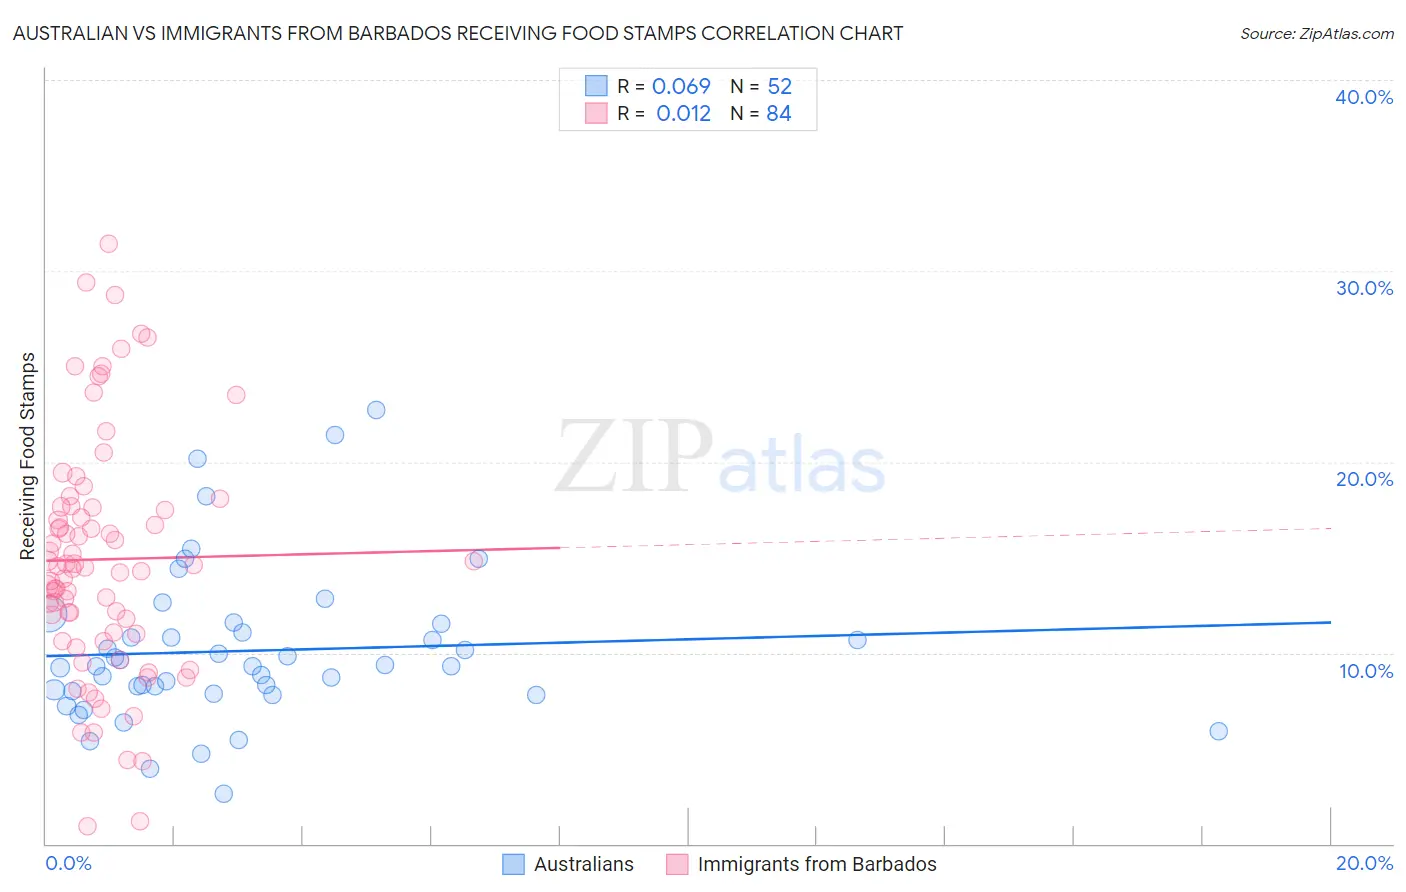
Australian vs Immigrants from Barbados Receiving Food Stamps Correlation Chart
The statistical analysis conducted on geographies consisting of 223,620,943 people shows a slight positive correlation between the proportion of Australians and percentage of population receiving government assistance and/or food stamps in the United States with a correlation coefficient (R) of 0.069 and weighted average of 9.6%. Similarly, the statistical analysis conducted on geographies consisting of 112,654,620 people shows no correlation between the proportion of Immigrants from Barbados and percentage of population receiving government assistance and/or food stamps in the United States with a correlation coefficient (R) of 0.012 and weighted average of 16.6%, a difference of 72.8%.
Receiving Food Stamps Correlation Summary
| Measurement | Australian | Immigrants from Barbados |
| Minimum | 2.7% | 0.90% |
| Maximum | 22.7% | 31.4% |
| Range | 20.0% | 30.5% |
| Mean | 10.1% | 14.9% |
| Median | 9.3% | 14.5% |
| Interquartile 25% (IQ1) | 7.9% | 11.0% |
| Interquartile 75% (IQ3) | 11.3% | 17.6% |
| Interquartile Range (IQR) | 3.3% | 6.6% |
| Standard Deviation (Sample) | 4.1% | 6.2% |
| Standard Deviation (Population) | 4.0% | 6.2% |
Similar Demographics by Receiving Food Stamps
Demographics Similar to Australians by Receiving Food Stamps
In terms of receiving food stamps, the demographic groups most similar to Australians are Indian (Asian) (9.6%, a difference of 0.070%), Immigrants from Belgium (9.6%, a difference of 0.080%), Immigrants from Denmark (9.6%, a difference of 0.11%), Russian (9.6%, a difference of 0.17%), and Immigrants from Czechoslovakia (9.6%, a difference of 0.19%).
| Demographics | Rating | Rank | Receiving Food Stamps |
| Immigrants | Bolivia | 99.5 /100 | #39 | Exceptional 9.5% |
| Immigrants | Netherlands | 99.5 /100 | #40 | Exceptional 9.5% |
| Cambodians | 99.5 /100 | #41 | Exceptional 9.5% |
| Immigrants | China | 99.5 /100 | #42 | Exceptional 9.6% |
| Croatians | 99.5 /100 | #43 | Exceptional 9.6% |
| Immigrants | Denmark | 99.4 /100 | #44 | Exceptional 9.6% |
| Immigrants | Belgium | 99.4 /100 | #45 | Exceptional 9.6% |
| Australians | 99.4 /100 | #46 | Exceptional 9.6% |
| Indians (Asian) | 99.4 /100 | #47 | Exceptional 9.6% |
| Russians | 99.4 /100 | #48 | Exceptional 9.6% |
| Immigrants | Czechoslovakia | 99.4 /100 | #49 | Exceptional 9.6% |
| Lithuanians | 99.4 /100 | #50 | Exceptional 9.7% |
| Asians | 99.3 /100 | #51 | Exceptional 9.7% |
| Immigrants | South Africa | 99.3 /100 | #52 | Exceptional 9.7% |
| Tongans | 99.3 /100 | #53 | Exceptional 9.7% |
Demographics Similar to Immigrants from Barbados by Receiving Food Stamps
In terms of receiving food stamps, the demographic groups most similar to Immigrants from Barbados are Guyanese (16.7%, a difference of 0.52%), U.S. Virgin Islander (16.5%, a difference of 0.56%), Barbadian (16.5%, a difference of 0.79%), Houma (16.5%, a difference of 1.1%), and Sioux (16.8%, a difference of 1.2%).
| Demographics | Rating | Rank | Receiving Food Stamps |
| Nicaraguans | 0.0 /100 | #303 | Tragic 16.1% |
| West Indians | 0.0 /100 | #304 | Tragic 16.3% |
| Immigrants | Azores | 0.0 /100 | #305 | Tragic 16.4% |
| Jamaicans | 0.0 /100 | #306 | Tragic 16.4% |
| Houma | 0.0 /100 | #307 | Tragic 16.5% |
| Barbadians | 0.0 /100 | #308 | Tragic 16.5% |
| U.S. Virgin Islanders | 0.0 /100 | #309 | Tragic 16.5% |
| Immigrants | Barbados | 0.0 /100 | #310 | Tragic 16.6% |
| Guyanese | 0.0 /100 | #311 | Tragic 16.7% |
| Sioux | 0.0 /100 | #312 | Tragic 16.8% |
| Immigrants | Jamaica | 0.0 /100 | #313 | Tragic 16.9% |
| Immigrants | Guyana | 0.0 /100 | #314 | Tragic 16.9% |
| Bahamians | 0.0 /100 | #315 | Tragic 17.0% |
| Central American Indians | 0.0 /100 | #316 | Tragic 17.1% |
| Blacks/African Americans | 0.0 /100 | #317 | Tragic 17.2% |