Apache vs Immigrants from Barbados Male Poverty
COMPARE
Apache
Immigrants from Barbados
Male Poverty
Male Poverty Comparison
Apache
Immigrants from Barbados
17.7%
MALE POVERTY
0.0/ 100
METRIC RATING
335th/ 347
METRIC RANK
13.8%
MALE POVERTY
0.0/ 100
METRIC RATING
287th/ 347
METRIC RANK
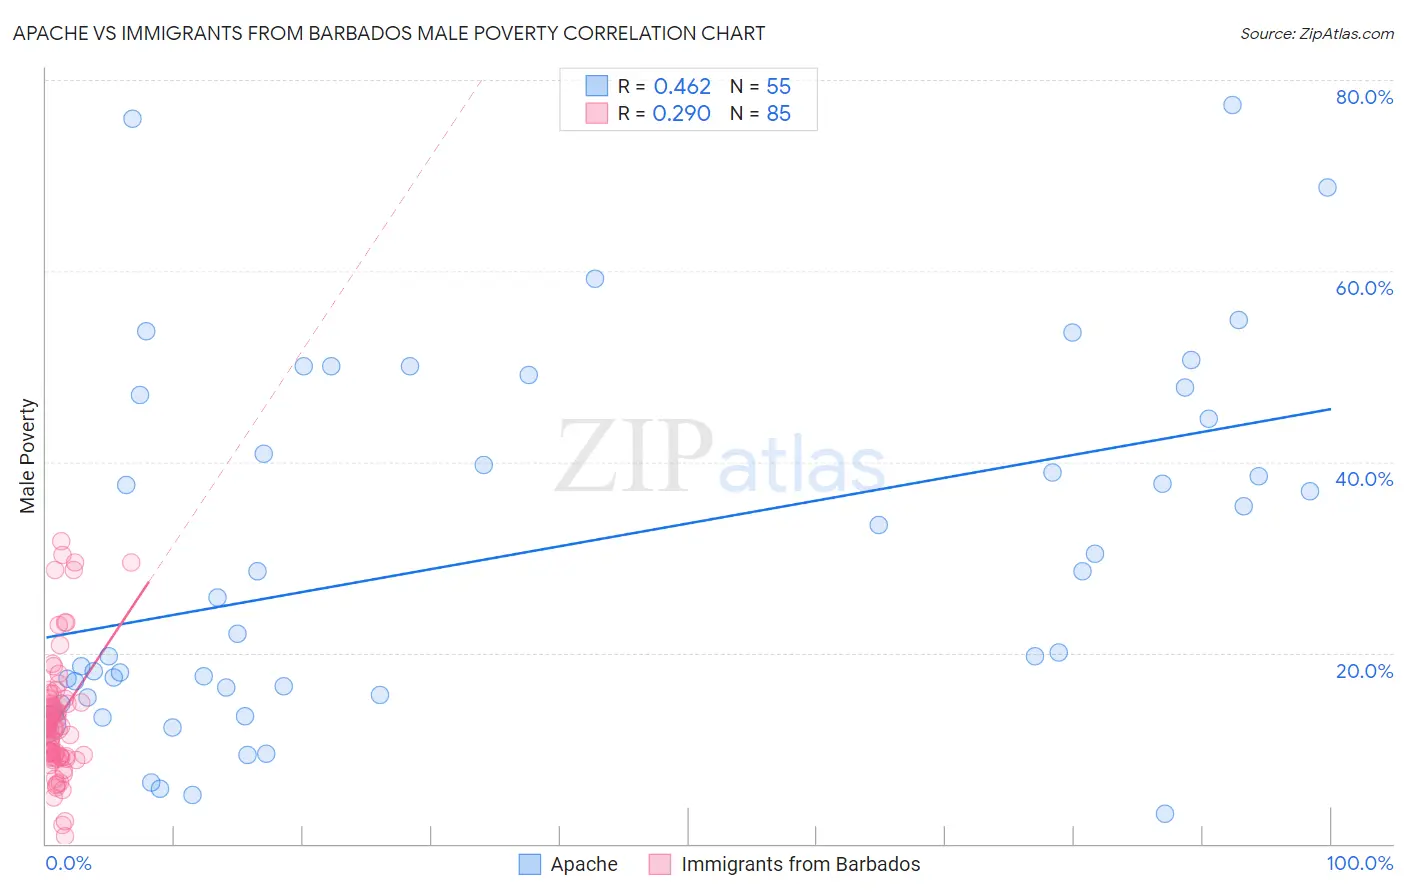
Apache vs Immigrants from Barbados Male Poverty Correlation Chart
The statistical analysis conducted on geographies consisting of 231,014,108 people shows a moderate positive correlation between the proportion of Apache and poverty level among males in the United States with a correlation coefficient (R) of 0.462 and weighted average of 17.7%. Similarly, the statistical analysis conducted on geographies consisting of 112,769,360 people shows a weak positive correlation between the proportion of Immigrants from Barbados and poverty level among males in the United States with a correlation coefficient (R) of 0.290 and weighted average of 13.8%, a difference of 28.4%.
Male Poverty Correlation Summary
| Measurement | Apache | Immigrants from Barbados |
| Minimum | 3.1% | 0.81% |
| Maximum | 77.3% | 31.7% |
| Range | 74.2% | 30.9% |
| Mean | 30.4% | 13.0% |
| Median | 25.8% | 12.0% |
| Interquartile 25% (IQ1) | 15.6% | 9.1% |
| Interquartile 75% (IQ3) | 47.0% | 14.7% |
| Interquartile Range (IQR) | 31.5% | 5.6% |
| Standard Deviation (Sample) | 18.8% | 6.3% |
| Standard Deviation (Population) | 18.6% | 6.2% |
Similar Demographics by Male Poverty
Demographics Similar to Apache by Male Poverty
In terms of male poverty, the demographic groups most similar to Apache are Cheyenne (17.6%, a difference of 0.20%), Native/Alaskan (16.9%, a difference of 4.4%), Pueblo (18.5%, a difference of 4.8%), Houma (16.7%, a difference of 5.7%), and Sioux (18.7%, a difference of 5.9%).
| Demographics | Rating | Rank | Male Poverty |
| Blacks/African Americans | 0.0 /100 | #328 | Tragic 15.8% |
| Dominicans | 0.0 /100 | #329 | Tragic 16.1% |
| Immigrants | Dominican Republic | 0.0 /100 | #330 | Tragic 16.2% |
| Ute | 0.0 /100 | #331 | Tragic 16.2% |
| Houma | 0.0 /100 | #332 | Tragic 16.7% |
| Natives/Alaskans | 0.0 /100 | #333 | Tragic 16.9% |
| Cheyenne | 0.0 /100 | #334 | Tragic 17.6% |
| Apache | 0.0 /100 | #335 | Tragic 17.7% |
| Pueblo | 0.0 /100 | #336 | Tragic 18.5% |
| Sioux | 0.0 /100 | #337 | Tragic 18.7% |
| Crow | 0.0 /100 | #338 | Tragic 19.1% |
| Yuman | 0.0 /100 | #339 | Tragic 19.5% |
| Immigrants | Yemen | 0.0 /100 | #340 | Tragic 20.1% |
| Lumbee | 0.0 /100 | #341 | Tragic 20.2% |
| Pima | 0.0 /100 | #342 | Tragic 20.4% |
Demographics Similar to Immigrants from Barbados by Male Poverty
In terms of male poverty, the demographic groups most similar to Immigrants from Barbados are Shoshone (13.8%, a difference of 0.020%), West Indian (13.8%, a difference of 0.050%), Immigrants from Haiti (13.8%, a difference of 0.060%), Comanche (13.8%, a difference of 0.070%), and Immigrants from St. Vincent and the Grenadines (13.8%, a difference of 0.17%).
| Demographics | Rating | Rank | Male Poverty |
| Mexicans | 0.0 /100 | #280 | Tragic 13.7% |
| Yaqui | 0.0 /100 | #281 | Tragic 13.7% |
| Immigrants | Cabo Verde | 0.0 /100 | #282 | Tragic 13.7% |
| Comanche | 0.0 /100 | #283 | Tragic 13.8% |
| Immigrants | Haiti | 0.0 /100 | #284 | Tragic 13.8% |
| West Indians | 0.0 /100 | #285 | Tragic 13.8% |
| Shoshone | 0.0 /100 | #286 | Tragic 13.8% |
| Immigrants | Barbados | 0.0 /100 | #287 | Tragic 13.8% |
| Immigrants | St. Vincent and the Grenadines | 0.0 /100 | #288 | Tragic 13.8% |
| Guatemalans | 0.0 /100 | #289 | Tragic 13.8% |
| Immigrants | Zaire | 0.0 /100 | #290 | Tragic 13.8% |
| Vietnamese | 0.0 /100 | #291 | Tragic 13.8% |
| Indonesians | 0.0 /100 | #292 | Tragic 13.8% |
| Immigrants | Belize | 0.0 /100 | #293 | Tragic 13.8% |
| Hispanics or Latinos | 0.0 /100 | #294 | Tragic 13.9% |