Apache vs Immigrants from Barbados Per Capita Income
COMPARE
Apache
Immigrants from Barbados
Per Capita Income
Per Capita Income Comparison
Apache
Immigrants from Barbados
$34,886
PER CAPITA INCOME
0.0/ 100
METRIC RATING
327th/ 347
METRIC RANK
$41,478
PER CAPITA INCOME
7.9/ 100
METRIC RATING
220th/ 347
METRIC RANK
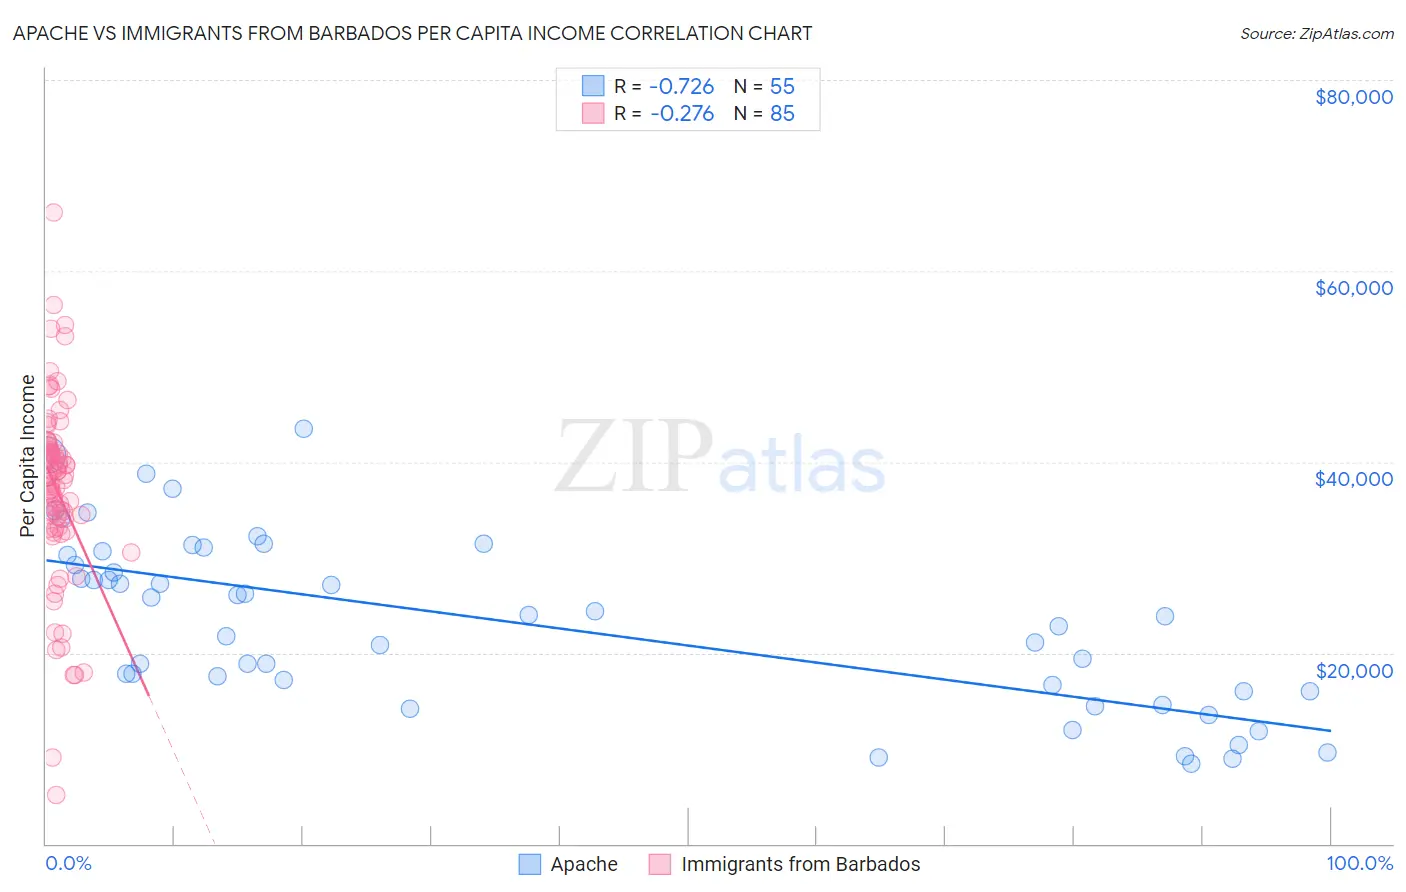
Apache vs Immigrants from Barbados Per Capita Income Correlation Chart
The statistical analysis conducted on geographies consisting of 231,148,099 people shows a strong negative correlation between the proportion of Apache and per capita income in the United States with a correlation coefficient (R) of -0.726 and weighted average of $34,886. Similarly, the statistical analysis conducted on geographies consisting of 112,709,172 people shows a weak negative correlation between the proportion of Immigrants from Barbados and per capita income in the United States with a correlation coefficient (R) of -0.276 and weighted average of $41,478, a difference of 18.9%.
Per Capita Income Correlation Summary
| Measurement | Apache | Immigrants from Barbados |
| Minimum | $8,398 | $5,075 |
| Maximum | $43,430 | $66,187 |
| Range | $35,032 | $61,112 |
| Mean | $23,117 | $37,004 |
| Median | $23,775 | $38,335 |
| Interquartile 25% (IQ1) | $15,985 | $33,039 |
| Interquartile 75% (IQ3) | $30,233 | $41,445 |
| Interquartile Range (IQR) | $14,248 | $8,406 |
| Standard Deviation (Sample) | $8,932 | $9,798 |
| Standard Deviation (Population) | $8,851 | $9,740 |
Similar Demographics by Per Capita Income
Demographics Similar to Apache by Per Capita Income
In terms of per capita income, the demographic groups most similar to Apache are Immigrants from Cuba ($34,910, a difference of 0.070%), Immigrants from Central America ($34,974, a difference of 0.25%), Kiowa ($35,102, a difference of 0.62%), Menominee ($34,578, a difference of 0.89%), and Mexican ($34,559, a difference of 0.95%).
| Demographics | Rating | Rank | Per Capita Income |
| Hispanics or Latinos | 0.0 /100 | #320 | Tragic $35,688 |
| Blacks/African Americans | 0.0 /100 | #321 | Tragic $35,564 |
| Creek | 0.0 /100 | #322 | Tragic $35,546 |
| Cheyenne | 0.0 /100 | #323 | Tragic $35,276 |
| Kiowa | 0.0 /100 | #324 | Tragic $35,102 |
| Immigrants | Central America | 0.0 /100 | #325 | Tragic $34,974 |
| Immigrants | Cuba | 0.0 /100 | #326 | Tragic $34,910 |
| Apache | 0.0 /100 | #327 | Tragic $34,886 |
| Menominee | 0.0 /100 | #328 | Tragic $34,578 |
| Mexicans | 0.0 /100 | #329 | Tragic $34,559 |
| Spanish American Indians | 0.0 /100 | #330 | Tragic $34,195 |
| Immigrants | Mexico | 0.0 /100 | #331 | Tragic $33,931 |
| Sioux | 0.0 /100 | #332 | Tragic $33,921 |
| Immigrants | Yemen | 0.0 /100 | #333 | Tragic $33,696 |
| Natives/Alaskans | 0.0 /100 | #334 | Tragic $33,279 |
Demographics Similar to Immigrants from Barbados by Per Capita Income
In terms of per capita income, the demographic groups most similar to Immigrants from Barbados are Immigrants from Trinidad and Tobago ($41,476, a difference of 0.0%), Puget Sound Salish ($41,495, a difference of 0.040%), Immigrants from Iraq ($41,365, a difference of 0.27%), Immigrants from Cameroon ($41,334, a difference of 0.35%), and Trinidadian and Tobagonian ($41,655, a difference of 0.43%).
| Demographics | Rating | Rank | Per Capita Income |
| Immigrants | Venezuela | 10.2 /100 | #213 | Poor $41,727 |
| Immigrants | Bangladesh | 10.1 /100 | #214 | Poor $41,709 |
| Sudanese | 9.9 /100 | #215 | Tragic $41,695 |
| Tongans | 9.9 /100 | #216 | Tragic $41,693 |
| Guamanians/Chamorros | 9.7 /100 | #217 | Tragic $41,678 |
| Trinidadians and Tobagonians | 9.5 /100 | #218 | Tragic $41,655 |
| Puget Sound Salish | 8.1 /100 | #219 | Tragic $41,495 |
| Immigrants | Barbados | 7.9 /100 | #220 | Tragic $41,478 |
| Immigrants | Trinidad and Tobago | 7.9 /100 | #221 | Tragic $41,476 |
| Immigrants | Iraq | 7.1 /100 | #222 | Tragic $41,365 |
| Immigrants | Cameroon | 6.8 /100 | #223 | Tragic $41,334 |
| Immigrants | St. Vincent and the Grenadines | 6.4 /100 | #224 | Tragic $41,270 |
| West Indians | 6.0 /100 | #225 | Tragic $41,217 |
| Immigrants | Ecuador | 5.9 /100 | #226 | Tragic $41,195 |
| Immigrants | Ghana | 5.5 /100 | #227 | Tragic $41,131 |