Apache vs Immigrants from Barbados High School Diploma
COMPARE
Apache
Immigrants from Barbados
High School Diploma
High School Diploma Comparison
Apache
Immigrants from Barbados
85.1%
HIGH SCHOOL DIPLOMA
0.0/ 100
METRIC RATING
310th/ 347
METRIC RANK
86.4%
HIGH SCHOOL DIPLOMA
0.0/ 100
METRIC RATING
283rd/ 347
METRIC RANK
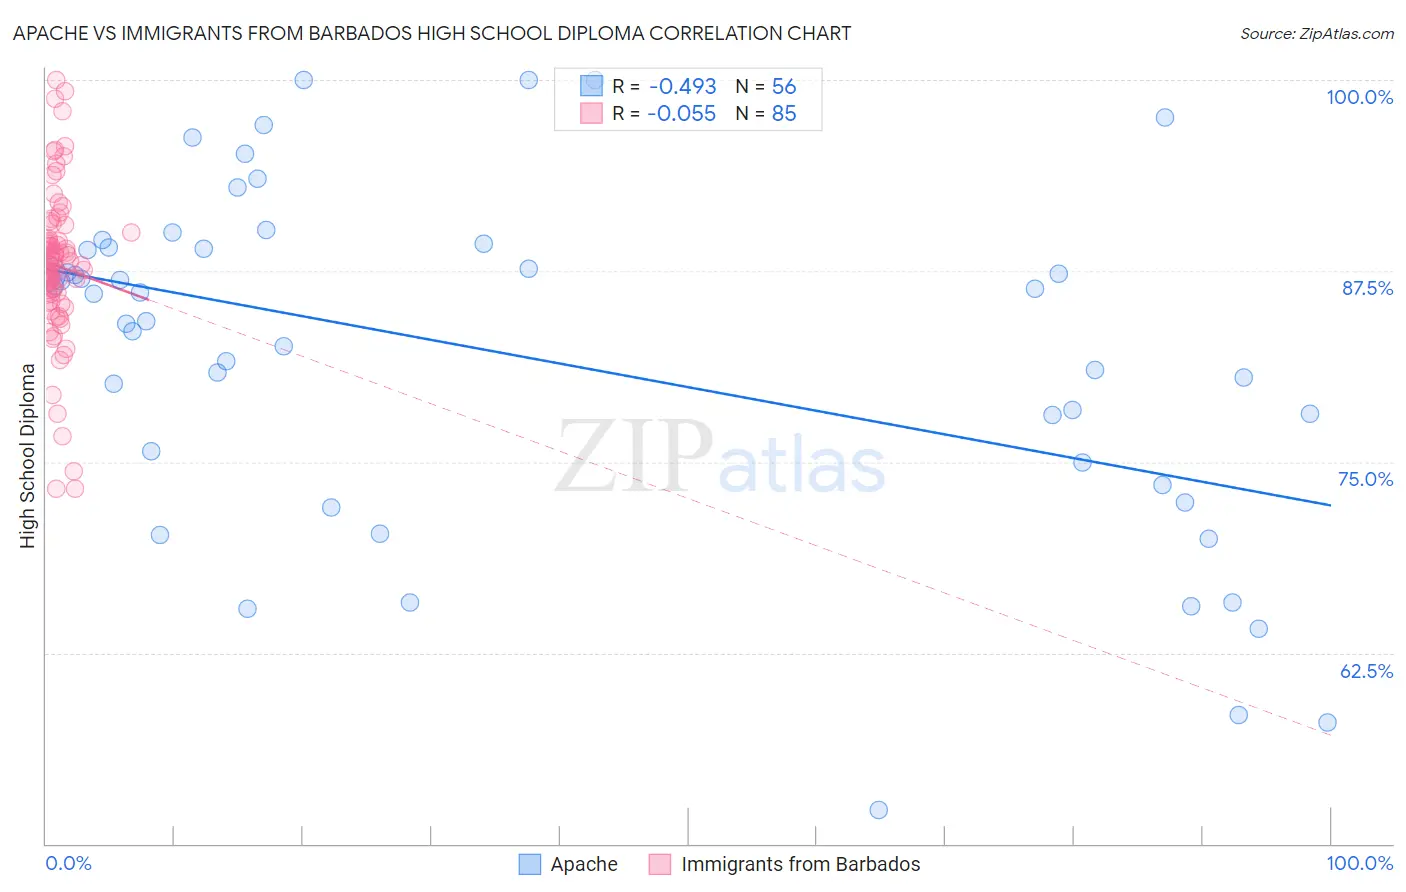
Apache vs Immigrants from Barbados High School Diploma Correlation Chart
The statistical analysis conducted on geographies consisting of 231,143,094 people shows a moderate negative correlation between the proportion of Apache and percentage of population with at least high school diploma education in the United States with a correlation coefficient (R) of -0.493 and weighted average of 85.1%. Similarly, the statistical analysis conducted on geographies consisting of 112,782,130 people shows a slight negative correlation between the proportion of Immigrants from Barbados and percentage of population with at least high school diploma education in the United States with a correlation coefficient (R) of -0.055 and weighted average of 86.4%, a difference of 1.5%.
High School Diploma Correlation Summary
| Measurement | Apache | Immigrants from Barbados |
| Minimum | 52.2% | 73.3% |
| Maximum | 100.0% | 100.0% |
| Range | 47.8% | 26.7% |
| Mean | 81.9% | 87.8% |
| Median | 85.1% | 87.9% |
| Interquartile 25% (IQ1) | 74.2% | 85.7% |
| Interquartile 75% (IQ3) | 89.0% | 89.8% |
| Interquartile Range (IQR) | 14.8% | 4.1% |
| Standard Deviation (Sample) | 11.3% | 5.1% |
| Standard Deviation (Population) | 11.2% | 5.0% |
Similar Demographics by High School Diploma
Demographics Similar to Apache by High School Diploma
In terms of high school diploma, the demographic groups most similar to Apache are Ecuadorian (85.1%, a difference of 0.010%), Cape Verdean (85.1%, a difference of 0.060%), Immigrants from Dominica (85.2%, a difference of 0.080%), Immigrants from Armenia (85.2%, a difference of 0.090%), and Navajo (85.2%, a difference of 0.10%).
| Demographics | Rating | Rank | High School Diploma |
| Cubans | 0.0 /100 | #303 | Tragic 85.4% |
| Nepalese | 0.0 /100 | #304 | Tragic 85.3% |
| Immigrants | Portugal | 0.0 /100 | #305 | Tragic 85.3% |
| Immigrants | Guyana | 0.0 /100 | #306 | Tragic 85.3% |
| Navajo | 0.0 /100 | #307 | Tragic 85.2% |
| Immigrants | Armenia | 0.0 /100 | #308 | Tragic 85.2% |
| Immigrants | Dominica | 0.0 /100 | #309 | Tragic 85.2% |
| Apache | 0.0 /100 | #310 | Tragic 85.1% |
| Ecuadorians | 0.0 /100 | #311 | Tragic 85.1% |
| Cape Verdeans | 0.0 /100 | #312 | Tragic 85.1% |
| Immigrants | Ecuador | 0.0 /100 | #313 | Tragic 84.8% |
| Yaqui | 0.0 /100 | #314 | Tragic 84.7% |
| Puerto Ricans | 0.0 /100 | #315 | Tragic 84.7% |
| Belizeans | 0.0 /100 | #316 | Tragic 84.3% |
| Immigrants | Caribbean | 0.0 /100 | #317 | Tragic 84.3% |
Demographics Similar to Immigrants from Barbados by High School Diploma
In terms of high school diploma, the demographic groups most similar to Immigrants from Barbados are Paiute (86.4%, a difference of 0.050%), Dutch West Indian (86.5%, a difference of 0.060%), Indonesian (86.5%, a difference of 0.10%), Pueblo (86.5%, a difference of 0.15%), and Immigrants from Laos (86.6%, a difference of 0.17%).
| Demographics | Rating | Rank | High School Diploma |
| Immigrants | Burma/Myanmar | 0.1 /100 | #276 | Tragic 86.7% |
| Barbadians | 0.1 /100 | #277 | Tragic 86.7% |
| Hopi | 0.1 /100 | #278 | Tragic 86.6% |
| Immigrants | Laos | 0.0 /100 | #279 | Tragic 86.6% |
| Pueblo | 0.0 /100 | #280 | Tragic 86.5% |
| Indonesians | 0.0 /100 | #281 | Tragic 86.5% |
| Dutch West Indians | 0.0 /100 | #282 | Tragic 86.5% |
| Immigrants | Barbados | 0.0 /100 | #283 | Tragic 86.4% |
| Paiute | 0.0 /100 | #284 | Tragic 86.4% |
| Immigrants | West Indies | 0.0 /100 | #285 | Tragic 86.2% |
| Immigrants | St. Vincent and the Grenadines | 0.0 /100 | #286 | Tragic 86.2% |
| Ute | 0.0 /100 | #287 | Tragic 86.2% |
| Immigrants | Vietnam | 0.0 /100 | #288 | Tragic 86.2% |
| Yup'ik | 0.0 /100 | #289 | Tragic 86.1% |
| Fijians | 0.0 /100 | #290 | Tragic 86.0% |