American vs Immigrants from South Central Asia Married-Couple Family Poverty
COMPARE
American
Immigrants from South Central Asia
Married-Couple Family Poverty
Married-Couple Family Poverty Comparison
Americans
Immigrants from South Central Asia
5.3%
MARRIED-COUPLE FAMILY POVERTY
35.4/ 100
METRIC RATING
185th/ 347
METRIC RANK
4.3%
MARRIED-COUPLE FAMILY POVERTY
99.8/ 100
METRIC RATING
47th/ 347
METRIC RANK
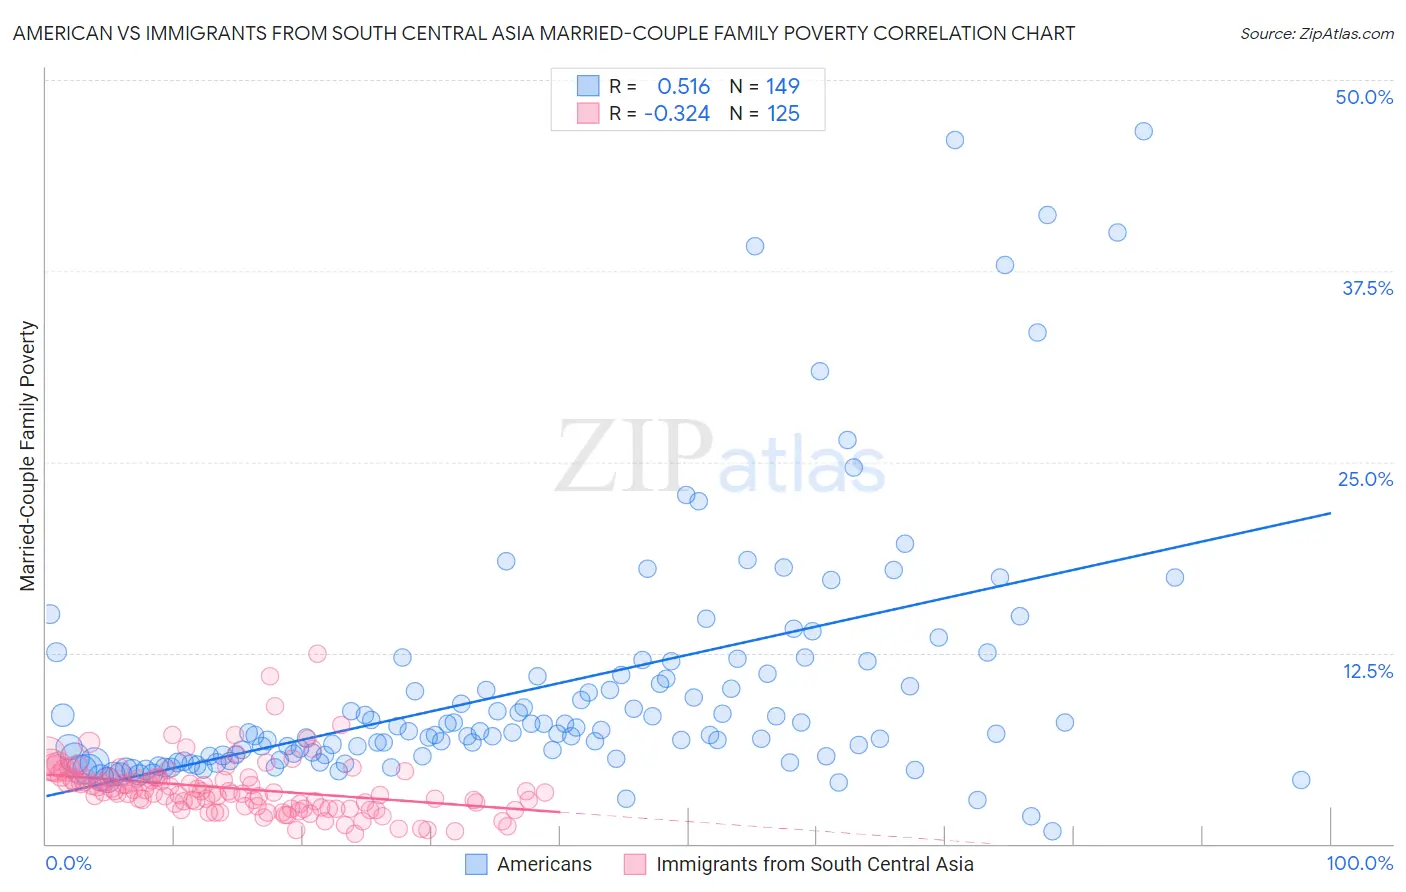
American vs Immigrants from South Central Asia Married-Couple Family Poverty Correlation Chart
The statistical analysis conducted on geographies consisting of 565,642,626 people shows a substantial positive correlation between the proportion of Americans and poverty level among married-couple families in the United States with a correlation coefficient (R) of 0.516 and weighted average of 5.3%. Similarly, the statistical analysis conducted on geographies consisting of 466,887,426 people shows a mild negative correlation between the proportion of Immigrants from South Central Asia and poverty level among married-couple families in the United States with a correlation coefficient (R) of -0.324 and weighted average of 4.3%, a difference of 23.3%.
Married-Couple Family Poverty Correlation Summary
| Measurement | American | Immigrants from South Central Asia |
| Minimum | 0.81% | 0.66% |
| Maximum | 46.7% | 12.4% |
| Range | 45.9% | 11.8% |
| Mean | 10.2% | 3.6% |
| Median | 7.2% | 3.4% |
| Interquartile 25% (IQ1) | 5.6% | 2.4% |
| Interquartile 75% (IQ3) | 11.0% | 4.3% |
| Interquartile Range (IQR) | 5.4% | 1.9% |
| Standard Deviation (Sample) | 8.4% | 1.8% |
| Standard Deviation (Population) | 8.3% | 1.8% |
Similar Demographics by Married-Couple Family Poverty
Demographics Similar to Americans by Married-Couple Family Poverty
In terms of married-couple family poverty, the demographic groups most similar to Americans are Nonimmigrants (5.3%, a difference of 0.060%), Hungarian (5.3%, a difference of 0.080%), Immigrants from Albania (5.3%, a difference of 0.19%), Peruvian (5.3%, a difference of 0.28%), and Israeli (5.3%, a difference of 0.28%).
| Demographics | Rating | Rank | Married-Couple Family Poverty |
| Immigrants | Ukraine | 44.9 /100 | #178 | Average 5.2% |
| Spanish | 41.4 /100 | #179 | Average 5.3% |
| Immigrants | Sierra Leone | 39.3 /100 | #180 | Fair 5.3% |
| Immigrants | Chile | 38.8 /100 | #181 | Fair 5.3% |
| Immigrants | Vietnam | 37.7 /100 | #182 | Fair 5.3% |
| Peruvians | 37.6 /100 | #183 | Fair 5.3% |
| Immigrants | Nonimmigrants | 35.8 /100 | #184 | Fair 5.3% |
| Americans | 35.4 /100 | #185 | Fair 5.3% |
| Hungarians | 34.7 /100 | #186 | Fair 5.3% |
| Immigrants | Albania | 33.8 /100 | #187 | Fair 5.3% |
| Israelis | 33.1 /100 | #188 | Fair 5.3% |
| South American Indians | 32.5 /100 | #189 | Fair 5.3% |
| Ugandans | 31.6 /100 | #190 | Fair 5.3% |
| Immigrants | Cabo Verde | 30.9 /100 | #191 | Fair 5.3% |
| Cape Verdeans | 30.7 /100 | #192 | Fair 5.3% |
Demographics Similar to Immigrants from South Central Asia by Married-Couple Family Poverty
In terms of married-couple family poverty, the demographic groups most similar to Immigrants from South Central Asia are Australian (4.3%, a difference of 0.070%), British (4.3%, a difference of 0.12%), Serbian (4.3%, a difference of 0.14%), Turkish (4.3%, a difference of 0.15%), and Immigrants from Japan (4.3%, a difference of 0.16%).
| Demographics | Rating | Rank | Married-Couple Family Poverty |
| French Canadians | 99.8 /100 | #40 | Exceptional 4.2% |
| Northern Europeans | 99.8 /100 | #41 | Exceptional 4.3% |
| Scottish | 99.8 /100 | #42 | Exceptional 4.3% |
| Swiss | 99.8 /100 | #43 | Exceptional 4.3% |
| Immigrants | Japan | 99.8 /100 | #44 | Exceptional 4.3% |
| Serbians | 99.8 /100 | #45 | Exceptional 4.3% |
| British | 99.8 /100 | #46 | Exceptional 4.3% |
| Immigrants | South Central Asia | 99.8 /100 | #47 | Exceptional 4.3% |
| Australians | 99.7 /100 | #48 | Exceptional 4.3% |
| Turks | 99.7 /100 | #49 | Exceptional 4.3% |
| Burmese | 99.7 /100 | #50 | Exceptional 4.3% |
| Immigrants | Lithuania | 99.7 /100 | #51 | Exceptional 4.3% |
| Russians | 99.7 /100 | #52 | Exceptional 4.3% |
| Welsh | 99.7 /100 | #53 | Exceptional 4.3% |
| Austrians | 99.7 /100 | #54 | Exceptional 4.3% |