American vs Immigrants from South Central Asia Cognitive Disability
COMPARE
American
Immigrants from South Central Asia
Cognitive Disability
Cognitive Disability Comparison
Americans
Immigrants from South Central Asia
17.2%
COGNITIVE DISABILITY
72.2/ 100
METRIC RATING
161st/ 347
METRIC RANK
16.4%
COGNITIVE DISABILITY
99.9/ 100
METRIC RATING
22nd/ 347
METRIC RANK
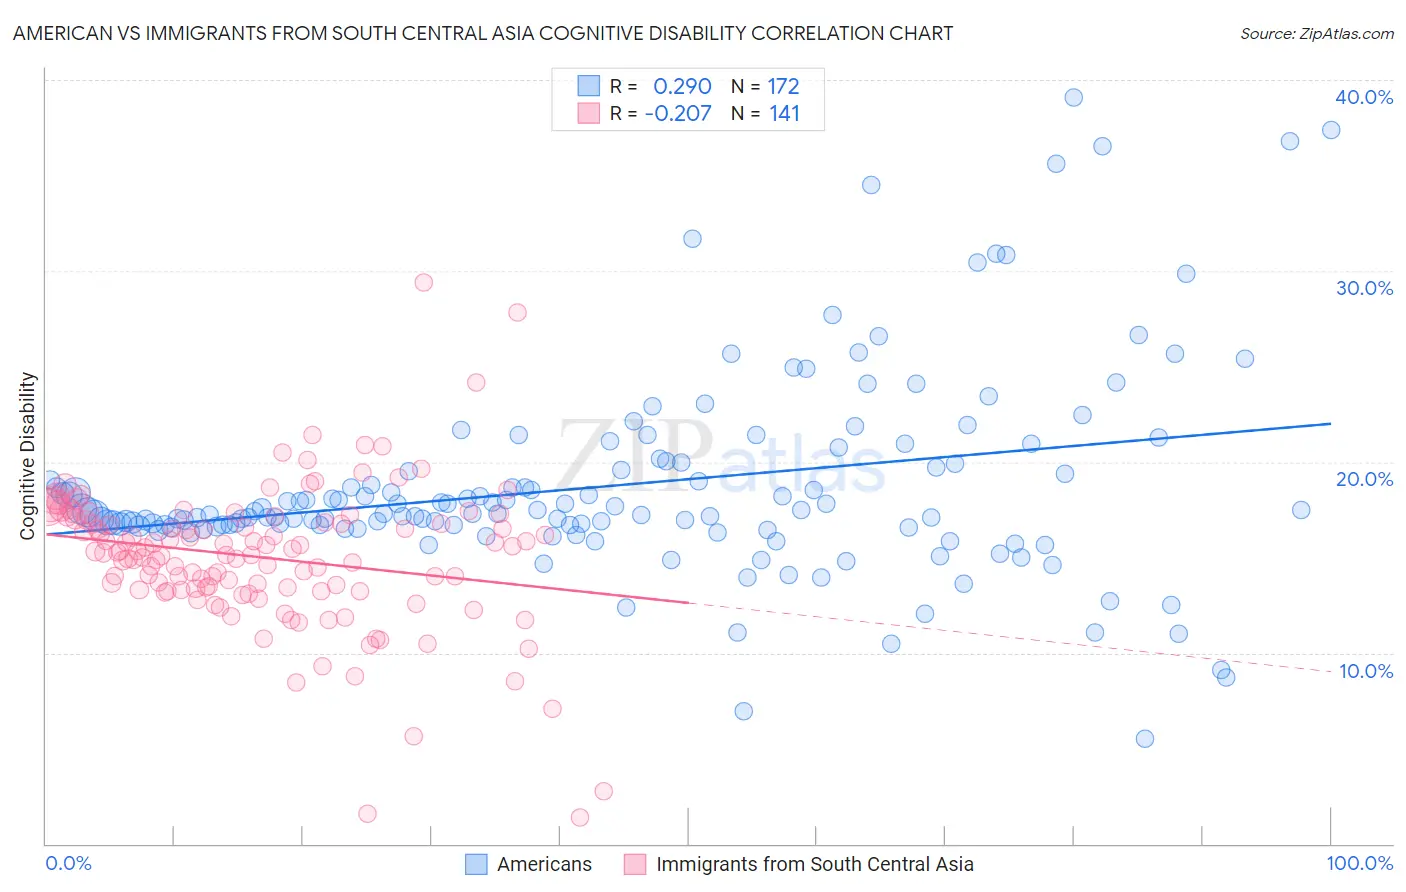
American vs Immigrants from South Central Asia Cognitive Disability Correlation Chart
The statistical analysis conducted on geographies consisting of 581,739,029 people shows a weak positive correlation between the proportion of Americans and percentage of population with cognitive disability in the United States with a correlation coefficient (R) of 0.290 and weighted average of 17.2%. Similarly, the statistical analysis conducted on geographies consisting of 473,055,858 people shows a weak negative correlation between the proportion of Immigrants from South Central Asia and percentage of population with cognitive disability in the United States with a correlation coefficient (R) of -0.207 and weighted average of 16.4%, a difference of 4.9%.
Cognitive Disability Correlation Summary
| Measurement | American | Immigrants from South Central Asia |
| Minimum | 5.5% | 1.4% |
| Maximum | 39.1% | 29.4% |
| Range | 33.6% | 28.0% |
| Mean | 18.8% | 15.0% |
| Median | 17.3% | 15.3% |
| Interquartile 25% (IQ1) | 16.6% | 13.3% |
| Interquartile 75% (IQ3) | 19.8% | 17.0% |
| Interquartile Range (IQR) | 3.2% | 3.7% |
| Standard Deviation (Sample) | 5.3% | 3.8% |
| Standard Deviation (Population) | 5.3% | 3.8% |
Similar Demographics by Cognitive Disability
Demographics Similar to Americans by Cognitive Disability
In terms of cognitive disability, the demographic groups most similar to Americans are Australian (17.2%, a difference of 0.010%), Yugoslavian (17.2%, a difference of 0.020%), Immigrants from Switzerland (17.2%, a difference of 0.020%), Immigrants from Latvia (17.2%, a difference of 0.040%), and Celtic (17.1%, a difference of 0.070%).
| Demographics | Rating | Rank | Cognitive Disability |
| Immigrants | Malaysia | 79.3 /100 | #154 | Good 17.1% |
| Brazilians | 78.9 /100 | #155 | Good 17.1% |
| Sri Lankans | 78.9 /100 | #156 | Good 17.1% |
| Immigrants | Australia | 76.0 /100 | #157 | Good 17.1% |
| Celtics | 74.1 /100 | #158 | Good 17.1% |
| Immigrants | Latvia | 73.2 /100 | #159 | Good 17.2% |
| Australians | 72.4 /100 | #160 | Good 17.2% |
| Americans | 72.2 /100 | #161 | Good 17.2% |
| Yugoslavians | 71.6 /100 | #162 | Good 17.2% |
| Immigrants | Switzerland | 71.5 /100 | #163 | Good 17.2% |
| Armenians | 70.1 /100 | #164 | Good 17.2% |
| Immigrants | Albania | 64.9 /100 | #165 | Good 17.2% |
| Immigrants | Ecuador | 64.4 /100 | #166 | Good 17.2% |
| Immigrants | Syria | 63.5 /100 | #167 | Good 17.2% |
| Immigrants | Immigrants | 62.5 /100 | #168 | Good 17.2% |
Demographics Similar to Immigrants from South Central Asia by Cognitive Disability
In terms of cognitive disability, the demographic groups most similar to Immigrants from South Central Asia are Croatian (16.4%, a difference of 0.030%), Immigrants from Argentina (16.4%, a difference of 0.060%), Luxembourger (16.4%, a difference of 0.10%), Immigrants from Cuba (16.3%, a difference of 0.13%), and Immigrants from Croatia (16.4%, a difference of 0.13%).
| Demographics | Rating | Rank | Cognitive Disability |
| Immigrants | Greece | 100.0 /100 | #15 | Exceptional 16.3% |
| Eastern Europeans | 100.0 /100 | #16 | Exceptional 16.3% |
| Immigrants | North Macedonia | 100.0 /100 | #17 | Exceptional 16.3% |
| Immigrants | Northern Europe | 100.0 /100 | #18 | Exceptional 16.3% |
| Immigrants | Bolivia | 100.0 /100 | #19 | Exceptional 16.3% |
| Bulgarians | 100.0 /100 | #20 | Exceptional 16.3% |
| Immigrants | Cuba | 100.0 /100 | #21 | Exceptional 16.3% |
| Immigrants | South Central Asia | 99.9 /100 | #22 | Exceptional 16.4% |
| Croatians | 99.9 /100 | #23 | Exceptional 16.4% |
| Immigrants | Argentina | 99.9 /100 | #24 | Exceptional 16.4% |
| Luxembourgers | 99.9 /100 | #25 | Exceptional 16.4% |
| Immigrants | Croatia | 99.9 /100 | #26 | Exceptional 16.4% |
| Immigrants | Pakistan | 99.9 /100 | #27 | Exceptional 16.4% |
| Poles | 99.9 /100 | #28 | Exceptional 16.4% |
| Filipinos | 99.9 /100 | #29 | Exceptional 16.4% |