Alaska Native vs Macedonian 9th Grade
COMPARE
Alaska Native
Macedonian
9th Grade
9th Grade Comparison
Alaska Natives
Macedonians
96.1%
9TH GRADE
99.9/ 100
METRIC RATING
44th/ 347
METRIC RANK
96.0%
9TH GRADE
99.8/ 100
METRIC RATING
57th/ 347
METRIC RANK
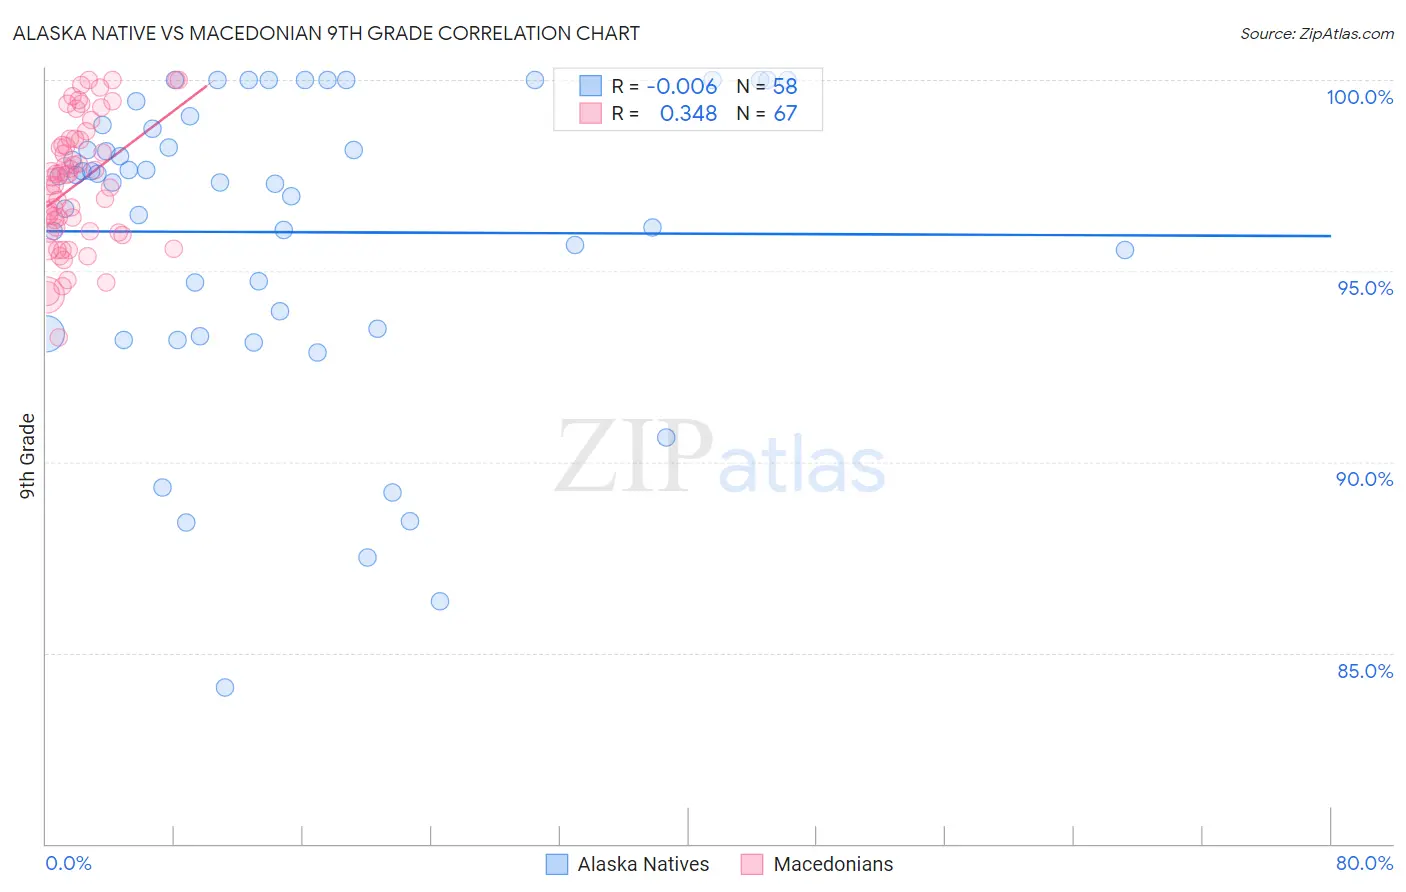
Alaska Native vs Macedonian 9th Grade Correlation Chart
The statistical analysis conducted on geographies consisting of 76,778,057 people shows no correlation between the proportion of Alaska Natives and percentage of population with at least 9th grade education in the United States with a correlation coefficient (R) of -0.006 and weighted average of 96.1%. Similarly, the statistical analysis conducted on geographies consisting of 132,581,663 people shows a mild positive correlation between the proportion of Macedonians and percentage of population with at least 9th grade education in the United States with a correlation coefficient (R) of 0.348 and weighted average of 96.0%, a difference of 0.11%.
9th Grade Correlation Summary
| Measurement | Alaska Native | Macedonian |
| Minimum | 84.1% | 93.3% |
| Maximum | 100.0% | 100.0% |
| Range | 15.9% | 6.7% |
| Mean | 96.0% | 97.3% |
| Median | 97.4% | 97.5% |
| Interquartile 25% (IQ1) | 93.5% | 96.0% |
| Interquartile 75% (IQ3) | 98.8% | 98.5% |
| Interquartile Range (IQR) | 5.3% | 2.5% |
| Standard Deviation (Sample) | 3.9% | 1.7% |
| Standard Deviation (Population) | 3.9% | 1.6% |
Demographics Similar to Alaska Natives and Macedonians by 9th Grade
In terms of 9th grade, the demographic groups most similar to Alaska Natives are Crow (96.1%, a difference of 0.010%), Immigrants from India (96.1%, a difference of 0.010%), Iranian (96.1%, a difference of 0.020%), Russian (96.0%, a difference of 0.020%), and Australian (96.0%, a difference of 0.020%). Similarly, the demographic groups most similar to Macedonians are Aleut (96.0%, a difference of 0.0%), Immigrants from Austria (96.0%, a difference of 0.010%), Immigrants from North America (96.0%, a difference of 0.010%), New Zealander (95.9%, a difference of 0.020%), and Immigrants from Canada (96.0%, a difference of 0.030%).
| Demographics | Rating | Rank | 9th Grade |
| Slavs | 99.9 /100 | #40 | Exceptional 96.1% |
| Czechoslovakians | 99.9 /100 | #41 | Exceptional 96.1% |
| Chippewa | 99.9 /100 | #42 | Exceptional 96.1% |
| Iranians | 99.9 /100 | #43 | Exceptional 96.1% |
| Alaska Natives | 99.9 /100 | #44 | Exceptional 96.1% |
| Crow | 99.9 /100 | #45 | Exceptional 96.1% |
| Immigrants | India | 99.9 /100 | #46 | Exceptional 96.1% |
| Russians | 99.9 /100 | #47 | Exceptional 96.0% |
| Australians | 99.9 /100 | #48 | Exceptional 96.0% |
| Greeks | 99.9 /100 | #49 | Exceptional 96.0% |
| Celtics | 99.9 /100 | #50 | Exceptional 96.0% |
| Immigrants | Northern Europe | 99.9 /100 | #51 | Exceptional 96.0% |
| Serbians | 99.9 /100 | #52 | Exceptional 96.0% |
| Austrians | 99.8 /100 | #53 | Exceptional 96.0% |
| Immigrants | Canada | 99.8 /100 | #54 | Exceptional 96.0% |
| Immigrants | Austria | 99.8 /100 | #55 | Exceptional 96.0% |
| Immigrants | North America | 99.8 /100 | #56 | Exceptional 96.0% |
| Macedonians | 99.8 /100 | #57 | Exceptional 96.0% |
| Aleuts | 99.8 /100 | #58 | Exceptional 96.0% |
| New Zealanders | 99.8 /100 | #59 | Exceptional 95.9% |
| Native Hawaiians | 99.8 /100 | #60 | Exceptional 95.9% |