Afghan vs Slavic Female Poverty
COMPARE
Afghan
Slavic
Female Poverty
Female Poverty Comparison
Afghans
Slavs
13.0%
FEMALE POVERTY
79.8/ 100
METRIC RATING
144th/ 347
METRIC RANK
12.5%
FEMALE POVERTY
94.5/ 100
METRIC RATING
103rd/ 347
METRIC RANK
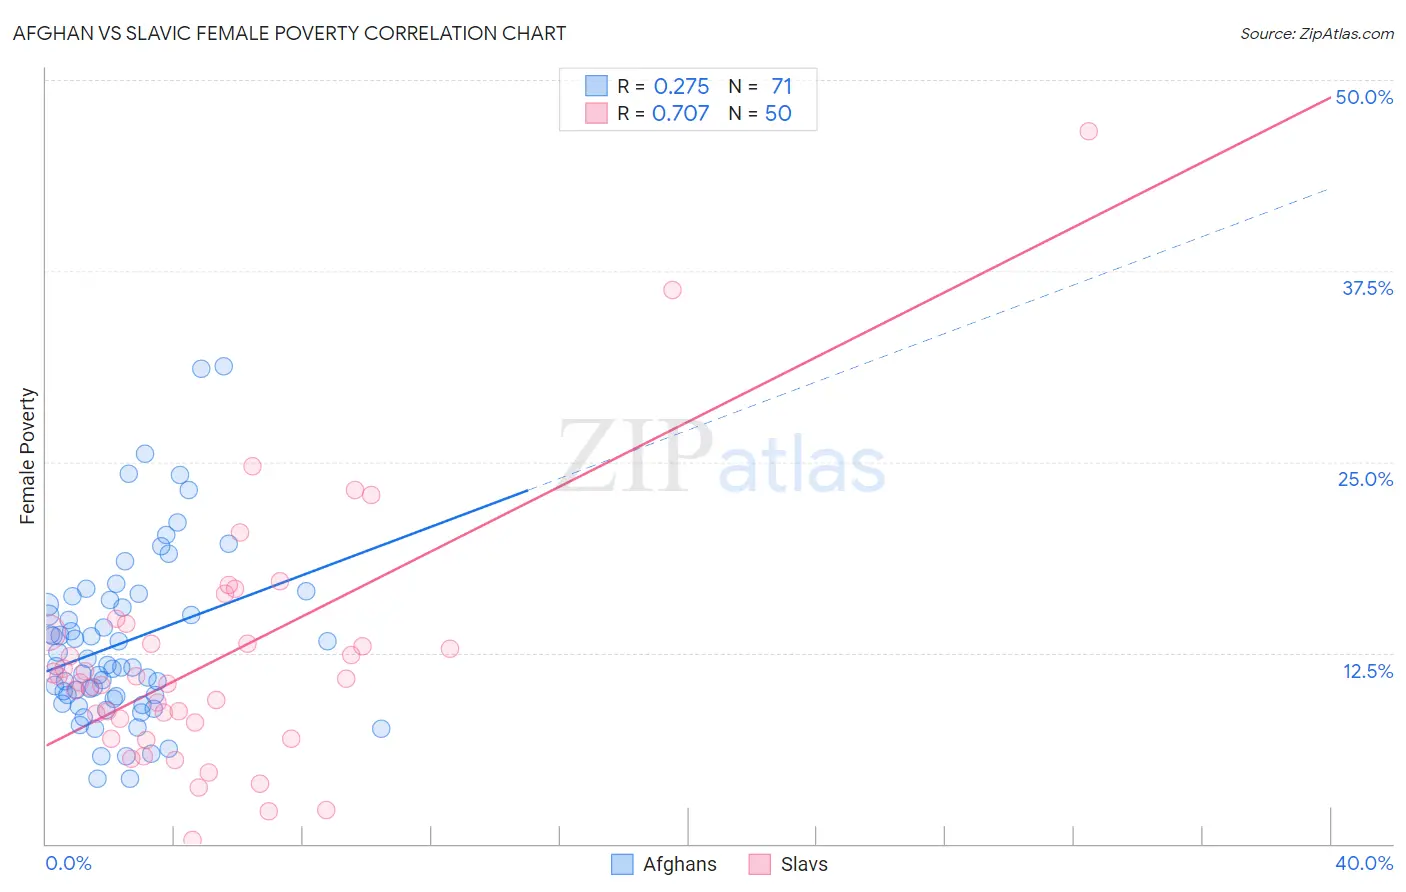
Afghan vs Slavic Female Poverty Correlation Chart
The statistical analysis conducted on geographies consisting of 148,814,784 people shows a weak positive correlation between the proportion of Afghans and poverty level among females in the United States with a correlation coefficient (R) of 0.275 and weighted average of 13.0%. Similarly, the statistical analysis conducted on geographies consisting of 270,757,305 people shows a strong positive correlation between the proportion of Slavs and poverty level among females in the United States with a correlation coefficient (R) of 0.707 and weighted average of 12.5%, a difference of 3.8%.
Female Poverty Correlation Summary
| Measurement | Afghan | Slavic |
| Minimum | 4.3% | 0.21% |
| Maximum | 31.3% | 46.6% |
| Range | 27.0% | 46.4% |
| Mean | 13.2% | 12.0% |
| Median | 11.6% | 10.7% |
| Interquartile 25% (IQ1) | 9.5% | 7.9% |
| Interquartile 75% (IQ3) | 16.0% | 13.8% |
| Interquartile Range (IQR) | 6.5% | 5.9% |
| Standard Deviation (Sample) | 5.7% | 8.1% |
| Standard Deviation (Population) | 5.6% | 8.0% |
Similar Demographics by Female Poverty
Demographics Similar to Afghans by Female Poverty
In terms of female poverty, the demographic groups most similar to Afghans are Syrian (13.0%, a difference of 0.030%), Immigrants from Malaysia (13.0%, a difference of 0.090%), Brazilian (13.0%, a difference of 0.11%), Immigrants from Peru (13.0%, a difference of 0.11%), and Immigrants from Kazakhstan (13.0%, a difference of 0.18%).
| Demographics | Rating | Rank | Female Poverty |
| Chileans | 84.7 /100 | #137 | Excellent 12.9% |
| Immigrants | France | 83.6 /100 | #138 | Excellent 12.9% |
| Basques | 83.1 /100 | #139 | Excellent 12.9% |
| Pakistanis | 83.0 /100 | #140 | Excellent 12.9% |
| Icelanders | 81.1 /100 | #141 | Excellent 13.0% |
| Brazilians | 80.5 /100 | #142 | Excellent 13.0% |
| Immigrants | Malaysia | 80.4 /100 | #143 | Excellent 13.0% |
| Afghans | 79.8 /100 | #144 | Good 13.0% |
| Syrians | 79.6 /100 | #145 | Good 13.0% |
| Immigrants | Peru | 79.1 /100 | #146 | Good 13.0% |
| Immigrants | Kazakhstan | 78.6 /100 | #147 | Good 13.0% |
| Yugoslavians | 76.9 /100 | #148 | Good 13.1% |
| Taiwanese | 75.7 /100 | #149 | Good 13.1% |
| Tsimshian | 75.5 /100 | #150 | Good 13.1% |
| Immigrants | Germany | 74.9 /100 | #151 | Good 13.1% |
Demographics Similar to Slavs by Female Poverty
In terms of female poverty, the demographic groups most similar to Slavs are Immigrants from China (12.5%, a difference of 0.020%), Palestinian (12.5%, a difference of 0.090%), Immigrants from Latvia (12.5%, a difference of 0.17%), Tlingit-Haida (12.5%, a difference of 0.17%), and Scottish (12.5%, a difference of 0.20%).
| Demographics | Rating | Rank | Female Poverty |
| British | 95.2 /100 | #96 | Exceptional 12.5% |
| Australians | 95.2 /100 | #97 | Exceptional 12.5% |
| Native Hawaiians | 95.1 /100 | #98 | Exceptional 12.5% |
| Romanians | 95.1 /100 | #99 | Exceptional 12.5% |
| Immigrants | Latvia | 94.8 /100 | #100 | Exceptional 12.5% |
| Tlingit-Haida | 94.8 /100 | #101 | Exceptional 12.5% |
| Immigrants | China | 94.5 /100 | #102 | Exceptional 12.5% |
| Slavs | 94.5 /100 | #103 | Exceptional 12.5% |
| Palestinians | 94.3 /100 | #104 | Exceptional 12.5% |
| Scottish | 94.1 /100 | #105 | Exceptional 12.5% |
| Immigrants | Turkey | 93.8 /100 | #106 | Exceptional 12.6% |
| Laotians | 93.4 /100 | #107 | Exceptional 12.6% |
| Portuguese | 93.1 /100 | #108 | Exceptional 12.6% |
| Immigrants | Zimbabwe | 93.1 /100 | #109 | Exceptional 12.6% |
| Paraguayans | 93.0 /100 | #110 | Exceptional 12.6% |