Immigrants from Uruguay vs Slavic Female Poverty
COMPARE
Immigrants from Uruguay
Slavic
Female Poverty
Female Poverty Comparison
Immigrants from Uruguay
Slavs
14.0%
FEMALE POVERTY
14.0/ 100
METRIC RATING
206th/ 347
METRIC RANK
12.5%
FEMALE POVERTY
94.5/ 100
METRIC RATING
103rd/ 347
METRIC RANK
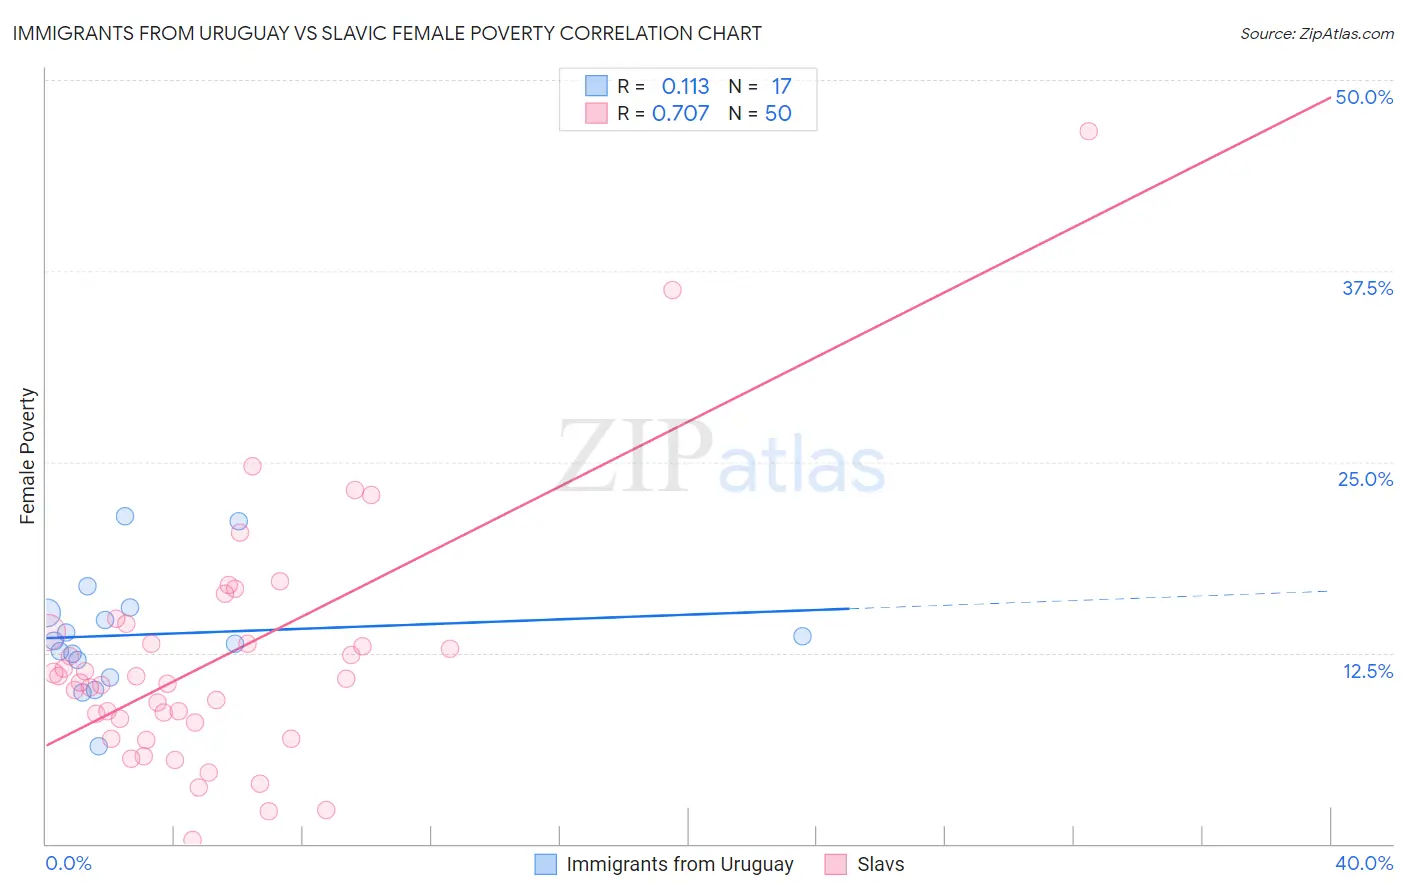
Immigrants from Uruguay vs Slavic Female Poverty Correlation Chart
The statistical analysis conducted on geographies consisting of 133,241,940 people shows a poor positive correlation between the proportion of Immigrants from Uruguay and poverty level among females in the United States with a correlation coefficient (R) of 0.113 and weighted average of 14.0%. Similarly, the statistical analysis conducted on geographies consisting of 270,757,305 people shows a strong positive correlation between the proportion of Slavs and poverty level among females in the United States with a correlation coefficient (R) of 0.707 and weighted average of 12.5%, a difference of 12.0%.
Female Poverty Correlation Summary
| Measurement | Immigrants from Uruguay | Slavic |
| Minimum | 6.4% | 0.21% |
| Maximum | 21.5% | 46.6% |
| Range | 15.1% | 46.4% |
| Mean | 13.7% | 12.0% |
| Median | 13.3% | 10.7% |
| Interquartile 25% (IQ1) | 11.4% | 7.9% |
| Interquartile 75% (IQ3) | 15.3% | 13.8% |
| Interquartile Range (IQR) | 3.9% | 5.9% |
| Standard Deviation (Sample) | 3.8% | 8.1% |
| Standard Deviation (Population) | 3.7% | 8.0% |
Similar Demographics by Female Poverty
Demographics Similar to Immigrants from Uruguay by Female Poverty
In terms of female poverty, the demographic groups most similar to Immigrants from Uruguay are Ugandan (14.0%, a difference of 0.27%), Spaniard (13.9%, a difference of 0.84%), Immigrants from Western Asia (13.9%, a difference of 1.1%), Immigrants from Eastern Africa (14.2%, a difference of 1.1%), and Hmong (13.9%, a difference of 1.2%).
| Demographics | Rating | Rank | Female Poverty |
| Immigrants | Lebanon | 25.6 /100 | #199 | Fair 13.8% |
| Spanish | 21.4 /100 | #200 | Fair 13.9% |
| Immigrants | Kenya | 21.1 /100 | #201 | Fair 13.9% |
| Hmong | 21.1 /100 | #202 | Fair 13.9% |
| Immigrants | Western Asia | 20.7 /100 | #203 | Fair 13.9% |
| Spaniards | 18.9 /100 | #204 | Poor 13.9% |
| Ugandans | 15.4 /100 | #205 | Poor 14.0% |
| Immigrants | Uruguay | 14.0 /100 | #206 | Poor 14.0% |
| Immigrants | Eastern Africa | 9.0 /100 | #207 | Tragic 14.2% |
| Immigrants | Azores | 7.9 /100 | #208 | Tragic 14.2% |
| Panamanians | 7.7 /100 | #209 | Tragic 14.2% |
| Malaysians | 7.4 /100 | #210 | Tragic 14.3% |
| Moroccans | 7.2 /100 | #211 | Tragic 14.3% |
| Bermudans | 5.5 /100 | #212 | Tragic 14.4% |
| Alaskan Athabascans | 5.3 /100 | #213 | Tragic 14.4% |
Demographics Similar to Slavs by Female Poverty
In terms of female poverty, the demographic groups most similar to Slavs are Immigrants from China (12.5%, a difference of 0.020%), Palestinian (12.5%, a difference of 0.090%), Immigrants from Latvia (12.5%, a difference of 0.17%), Tlingit-Haida (12.5%, a difference of 0.17%), and Scottish (12.5%, a difference of 0.20%).
| Demographics | Rating | Rank | Female Poverty |
| British | 95.2 /100 | #96 | Exceptional 12.5% |
| Australians | 95.2 /100 | #97 | Exceptional 12.5% |
| Native Hawaiians | 95.1 /100 | #98 | Exceptional 12.5% |
| Romanians | 95.1 /100 | #99 | Exceptional 12.5% |
| Immigrants | Latvia | 94.8 /100 | #100 | Exceptional 12.5% |
| Tlingit-Haida | 94.8 /100 | #101 | Exceptional 12.5% |
| Immigrants | China | 94.5 /100 | #102 | Exceptional 12.5% |
| Slavs | 94.5 /100 | #103 | Exceptional 12.5% |
| Palestinians | 94.3 /100 | #104 | Exceptional 12.5% |
| Scottish | 94.1 /100 | #105 | Exceptional 12.5% |
| Immigrants | Turkey | 93.8 /100 | #106 | Exceptional 12.6% |
| Laotians | 93.4 /100 | #107 | Exceptional 12.6% |
| Portuguese | 93.1 /100 | #108 | Exceptional 12.6% |
| Immigrants | Zimbabwe | 93.1 /100 | #109 | Exceptional 12.6% |
| Paraguayans | 93.0 /100 | #110 | Exceptional 12.6% |