Afghan vs Immigrants from Europe Female Poverty
COMPARE
Afghan
Immigrants from Europe
Female Poverty
Female Poverty Comparison
Afghans
Immigrants from Europe
13.0%
FEMALE POVERTY
79.8/ 100
METRIC RATING
144th/ 347
METRIC RANK
12.1%
FEMALE POVERTY
98.2/ 100
METRIC RATING
59th/ 347
METRIC RANK
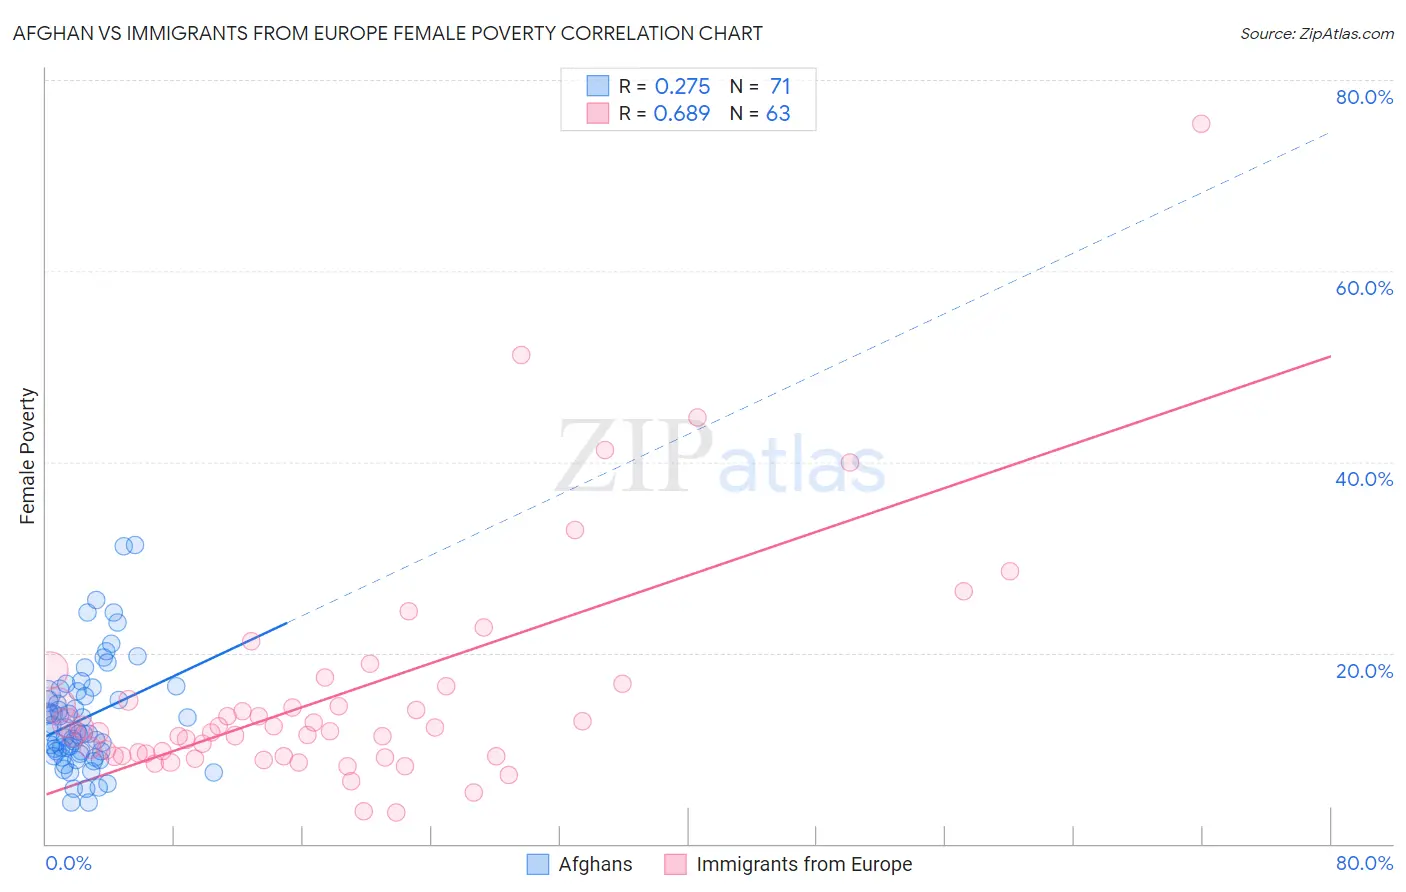
Afghan vs Immigrants from Europe Female Poverty Correlation Chart
The statistical analysis conducted on geographies consisting of 148,814,784 people shows a weak positive correlation between the proportion of Afghans and poverty level among females in the United States with a correlation coefficient (R) of 0.275 and weighted average of 13.0%. Similarly, the statistical analysis conducted on geographies consisting of 546,481,201 people shows a significant positive correlation between the proportion of Immigrants from Europe and poverty level among females in the United States with a correlation coefficient (R) of 0.689 and weighted average of 12.1%, a difference of 7.0%.
Female Poverty Correlation Summary
| Measurement | Afghan | Immigrants from Europe |
| Minimum | 4.3% | 3.3% |
| Maximum | 31.3% | 75.4% |
| Range | 27.0% | 72.1% |
| Mean | 13.2% | 15.7% |
| Median | 11.6% | 11.8% |
| Interquartile 25% (IQ1) | 9.5% | 9.2% |
| Interquartile 75% (IQ3) | 16.0% | 16.5% |
| Interquartile Range (IQR) | 6.5% | 7.3% |
| Standard Deviation (Sample) | 5.7% | 12.2% |
| Standard Deviation (Population) | 5.6% | 12.1% |
Similar Demographics by Female Poverty
Demographics Similar to Afghans by Female Poverty
In terms of female poverty, the demographic groups most similar to Afghans are Syrian (13.0%, a difference of 0.030%), Immigrants from Malaysia (13.0%, a difference of 0.090%), Brazilian (13.0%, a difference of 0.11%), Immigrants from Peru (13.0%, a difference of 0.11%), and Immigrants from Kazakhstan (13.0%, a difference of 0.18%).
| Demographics | Rating | Rank | Female Poverty |
| Chileans | 84.7 /100 | #137 | Excellent 12.9% |
| Immigrants | France | 83.6 /100 | #138 | Excellent 12.9% |
| Basques | 83.1 /100 | #139 | Excellent 12.9% |
| Pakistanis | 83.0 /100 | #140 | Excellent 12.9% |
| Icelanders | 81.1 /100 | #141 | Excellent 13.0% |
| Brazilians | 80.5 /100 | #142 | Excellent 13.0% |
| Immigrants | Malaysia | 80.4 /100 | #143 | Excellent 13.0% |
| Afghans | 79.8 /100 | #144 | Good 13.0% |
| Syrians | 79.6 /100 | #145 | Good 13.0% |
| Immigrants | Peru | 79.1 /100 | #146 | Good 13.0% |
| Immigrants | Kazakhstan | 78.6 /100 | #147 | Good 13.0% |
| Yugoslavians | 76.9 /100 | #148 | Good 13.1% |
| Taiwanese | 75.7 /100 | #149 | Good 13.1% |
| Tsimshian | 75.5 /100 | #150 | Good 13.1% |
| Immigrants | Germany | 74.9 /100 | #151 | Good 13.1% |
Demographics Similar to Immigrants from Europe by Female Poverty
In terms of female poverty, the demographic groups most similar to Immigrants from Europe are Scandinavian (12.1%, a difference of 0.010%), Immigrants from Serbia (12.1%, a difference of 0.090%), Estonian (12.1%, a difference of 0.15%), Immigrants from Australia (12.2%, a difference of 0.24%), and Immigrants from Asia (12.2%, a difference of 0.25%).
| Demographics | Rating | Rank | Female Poverty |
| Immigrants | Croatia | 98.7 /100 | #52 | Exceptional 12.0% |
| Immigrants | Austria | 98.7 /100 | #53 | Exceptional 12.0% |
| Immigrants | Philippines | 98.7 /100 | #54 | Exceptional 12.1% |
| Immigrants | Sri Lanka | 98.5 /100 | #55 | Exceptional 12.1% |
| Estonians | 98.3 /100 | #56 | Exceptional 12.1% |
| Immigrants | Serbia | 98.3 /100 | #57 | Exceptional 12.1% |
| Scandinavians | 98.2 /100 | #58 | Exceptional 12.1% |
| Immigrants | Europe | 98.2 /100 | #59 | Exceptional 12.1% |
| Immigrants | Australia | 98.1 /100 | #60 | Exceptional 12.2% |
| Immigrants | Asia | 98.1 /100 | #61 | Exceptional 12.2% |
| Immigrants | Italy | 98.0 /100 | #62 | Exceptional 12.2% |
| Ukrainians | 98.0 /100 | #63 | Exceptional 12.2% |
| Germans | 98.0 /100 | #64 | Exceptional 12.2% |
| Indians (Asian) | 97.9 /100 | #65 | Exceptional 12.2% |
| Austrians | 97.9 /100 | #66 | Exceptional 12.2% |