Afghan vs Immigrants from Uganda Female Poverty
COMPARE
Afghan
Immigrants from Uganda
Female Poverty
Female Poverty Comparison
Afghans
Immigrants from Uganda
13.0%
FEMALE POVERTY
79.8/ 100
METRIC RATING
144th/ 347
METRIC RANK
13.7%
FEMALE POVERTY
28.5/ 100
METRIC RATING
198th/ 347
METRIC RANK
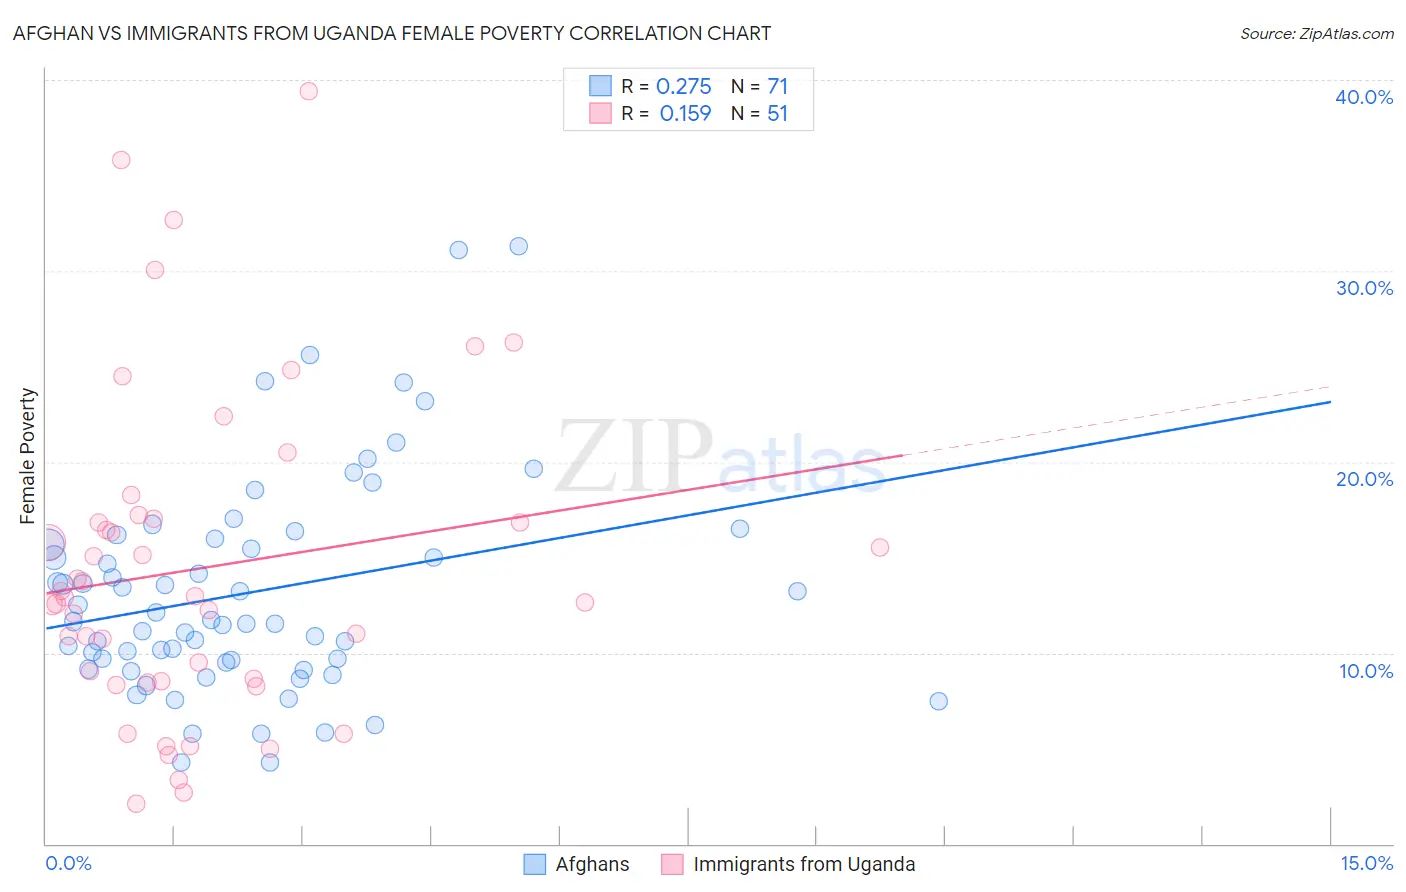
Afghan vs Immigrants from Uganda Female Poverty Correlation Chart
The statistical analysis conducted on geographies consisting of 148,814,784 people shows a weak positive correlation between the proportion of Afghans and poverty level among females in the United States with a correlation coefficient (R) of 0.275 and weighted average of 13.0%. Similarly, the statistical analysis conducted on geographies consisting of 125,969,010 people shows a poor positive correlation between the proportion of Immigrants from Uganda and poverty level among females in the United States with a correlation coefficient (R) of 0.159 and weighted average of 13.7%, a difference of 5.7%.
Female Poverty Correlation Summary
| Measurement | Afghan | Immigrants from Uganda |
| Minimum | 4.3% | 2.1% |
| Maximum | 31.3% | 39.4% |
| Range | 27.0% | 37.3% |
| Mean | 13.2% | 14.4% |
| Median | 11.6% | 12.9% |
| Interquartile 25% (IQ1) | 9.5% | 8.5% |
| Interquartile 75% (IQ3) | 16.0% | 17.0% |
| Interquartile Range (IQR) | 6.5% | 8.5% |
| Standard Deviation (Sample) | 5.7% | 8.4% |
| Standard Deviation (Population) | 5.6% | 8.3% |
Similar Demographics by Female Poverty
Demographics Similar to Afghans by Female Poverty
In terms of female poverty, the demographic groups most similar to Afghans are Syrian (13.0%, a difference of 0.030%), Immigrants from Malaysia (13.0%, a difference of 0.090%), Brazilian (13.0%, a difference of 0.11%), Immigrants from Peru (13.0%, a difference of 0.11%), and Immigrants from Kazakhstan (13.0%, a difference of 0.18%).
| Demographics | Rating | Rank | Female Poverty |
| Chileans | 84.7 /100 | #137 | Excellent 12.9% |
| Immigrants | France | 83.6 /100 | #138 | Excellent 12.9% |
| Basques | 83.1 /100 | #139 | Excellent 12.9% |
| Pakistanis | 83.0 /100 | #140 | Excellent 12.9% |
| Icelanders | 81.1 /100 | #141 | Excellent 13.0% |
| Brazilians | 80.5 /100 | #142 | Excellent 13.0% |
| Immigrants | Malaysia | 80.4 /100 | #143 | Excellent 13.0% |
| Afghans | 79.8 /100 | #144 | Good 13.0% |
| Syrians | 79.6 /100 | #145 | Good 13.0% |
| Immigrants | Peru | 79.1 /100 | #146 | Good 13.0% |
| Immigrants | Kazakhstan | 78.6 /100 | #147 | Good 13.0% |
| Yugoslavians | 76.9 /100 | #148 | Good 13.1% |
| Taiwanese | 75.7 /100 | #149 | Good 13.1% |
| Tsimshian | 75.5 /100 | #150 | Good 13.1% |
| Immigrants | Germany | 74.9 /100 | #151 | Good 13.1% |
Demographics Similar to Immigrants from Uganda by Female Poverty
In terms of female poverty, the demographic groups most similar to Immigrants from Uganda are Arab (13.7%, a difference of 0.010%), South American Indian (13.7%, a difference of 0.060%), Immigrants from South America (13.7%, a difference of 0.25%), Delaware (13.7%, a difference of 0.30%), and Immigrants from Lebanon (13.8%, a difference of 0.34%).
| Demographics | Rating | Rank | Female Poverty |
| Immigrants | Kuwait | 32.7 /100 | #191 | Fair 13.7% |
| Immigrants | Costa Rica | 31.9 /100 | #192 | Fair 13.7% |
| Iraqis | 31.8 /100 | #193 | Fair 13.7% |
| Delaware | 31.1 /100 | #194 | Fair 13.7% |
| Immigrants | South America | 30.6 /100 | #195 | Fair 13.7% |
| South American Indians | 28.9 /100 | #196 | Fair 13.7% |
| Arabs | 28.6 /100 | #197 | Fair 13.7% |
| Immigrants | Uganda | 28.5 /100 | #198 | Fair 13.7% |
| Immigrants | Lebanon | 25.6 /100 | #199 | Fair 13.8% |
| Spanish | 21.4 /100 | #200 | Fair 13.9% |
| Immigrants | Kenya | 21.1 /100 | #201 | Fair 13.9% |
| Hmong | 21.1 /100 | #202 | Fair 13.9% |
| Immigrants | Western Asia | 20.7 /100 | #203 | Fair 13.9% |
| Spaniards | 18.9 /100 | #204 | Poor 13.9% |
| Ugandans | 15.4 /100 | #205 | Poor 14.0% |