Zip Codes with the Highest Percentage of Population Employed in Real Estate, Rental & Leasing in Lancaster, PA
RELATED REPORTS & OPTIONS
Real Estate, Rental & Leasing
Lancaster
Compare Zip Codes
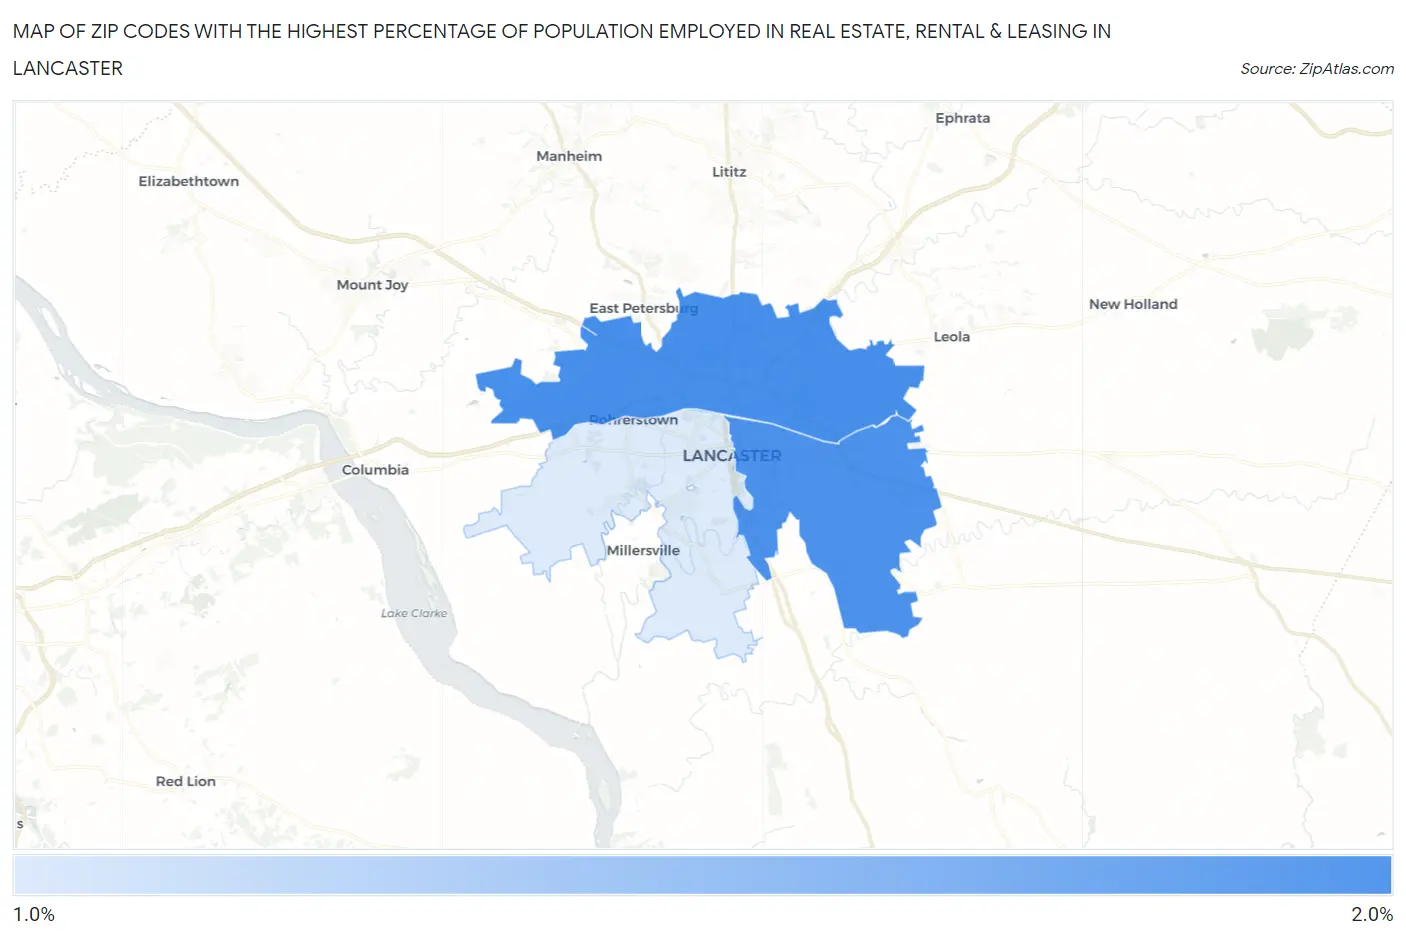
Map of Zip Codes with the Highest Percentage of Population Employed in Real Estate, Rental & Leasing in Lancaster
1.7%
1.8%
Zip Codes with the Highest Percentage of Population Employed in Real Estate, Rental & Leasing in Lancaster, PA
| Zip Code | % Employed | vs State | vs National | |
| 1. | 17601 | 1.8% | 1.5%(+0.316)#347 | 1.9%(-0.083)#9,066 |
| 2. | 17602 | 1.8% | 1.5%(+0.313)#350 | 1.9%(-0.086)#9,091 |
| 3. | 17603 | 1.7% | 1.5%(+0.218)#382 | 1.9%(-0.181)#9,689 |
1
Common Questions
What are the Top Zip Codes with the Highest Percentage of Population Employed in Real Estate, Rental & Leasing in Lancaster, PA?
Top Zip Codes with the Highest Percentage of Population Employed in Real Estate, Rental & Leasing in Lancaster, PA are:
What zip code has the Highest Percentage of Population Employed in Real Estate, Rental & Leasing in Lancaster, PA?
17601 has the Highest Percentage of Population Employed in Real Estate, Rental & Leasing in Lancaster, PA with 1.8%.
What is the Percentage of Population Employed in Real Estate, Rental & Leasing in Lancaster, PA?
Percentage of Population Employed in Real Estate, Rental & Leasing in Lancaster is 1.7%.
What is the Percentage of Population Employed in Real Estate, Rental & Leasing in Pennsylvania?
Percentage of Population Employed in Real Estate, Rental & Leasing in Pennsylvania is 1.5%.
What is the Percentage of Population Employed in Real Estate, Rental & Leasing in the United States?
Percentage of Population Employed in Real Estate, Rental & Leasing in the United States is 1.9%.