Zip Codes with the Highest Percentage of Families with Income Above $200,000 in Sparks, NV

RELATED REPORTS & OPTIONS

Family Income | $200k+
Population
Families and Households
Female Fertility
Female Fertility (Unmarried)
Race (Community Size)
Race (Percentage)
Ancestry (Community Size)
AfricanAlaska NativeAmericanApacheArabArgentineanArmenianAustralianAustrianBasqueBelgianBhutaneseBlackfeetBrazilianBritishBurmeseCajunCanadianCentral AmericanCentral American IndianCherokeeChileanChippewaChoctawColombianCreekCroatianCubanCzechCzechoslovakianDanishDutchEastern EuropeanEnglishEuropeanFinnishFrenchFrench CanadianGermanGhanaianGreekGuamanian / ChamorroGuatemalanHaitianHonduranHungarianIndian (Asian)IranianIrishIroquoisItalianKoreanLatvianLebaneseLithuanianMexicanMexican American IndianNative HawaiianNavajoNicaraguanNigerianNorthern EuropeanNorwegianPaiutePakistaniPanamanianPeruvianPolishPortuguesePuerto RicanRomanianRussianSalvadoranSamoanScandinavianScotch-IrishScottishSerbianShoshoneSiouxSlavicSlovakSloveneSouth AmericanSpaniardSpanishSri LankanSubsaharan AfricanSwedishSwissThaiTonganTurkishUkrainianUruguayanWelshYugoslavian
Ancestry (Percentage)
AfricanAlaska NativeAmericanApacheArabArgentineanArmenianAustralianAustrianBasqueBelgianBhutaneseBlackfeetBrazilianBritishBurmeseCajunCanadianCentral AmericanCentral American IndianCherokeeChileanChippewaChoctawColombianCreekCroatianCubanCzechCzechoslovakianDanishDutchEastern EuropeanEnglishEuropeanFinnishFrenchFrench CanadianGermanGhanaianGreekGuamanian / ChamorroGuatemalanHaitianHonduranHungarianIndian (Asian)IranianIrishIroquoisItalianKoreanLatvianLebaneseLithuanianMexicanMexican American IndianNative HawaiianNavajoNicaraguanNigerianNorthern EuropeanNorwegianPaiutePakistaniPanamanianPeruvianPolishPortuguesePuerto RicanRomanianRussianSalvadoranSamoanScandinavianScotch-IrishScottishSerbianShoshoneSiouxSlavicSlovakSloveneSouth AmericanSpaniardSpanishSri LankanSubsaharan AfricanSwedishSwissThaiTonganTurkishUkrainianUruguayanWelshYugoslavian
Immigrant Origin (Total)
Immigrant Origin (Percentage)
Income
Income (Families)
Income (Households)
Poverty
Poverty (Families)
Unemployment
Employment Occupations
Employment Industries
Employer Class
Commute Time
Commute Means
School Enrollment
Education by Degree Field
Occupancy
Finances
Physical Characteristics
Sparks
Compare Zip Codes
Comparison Subject

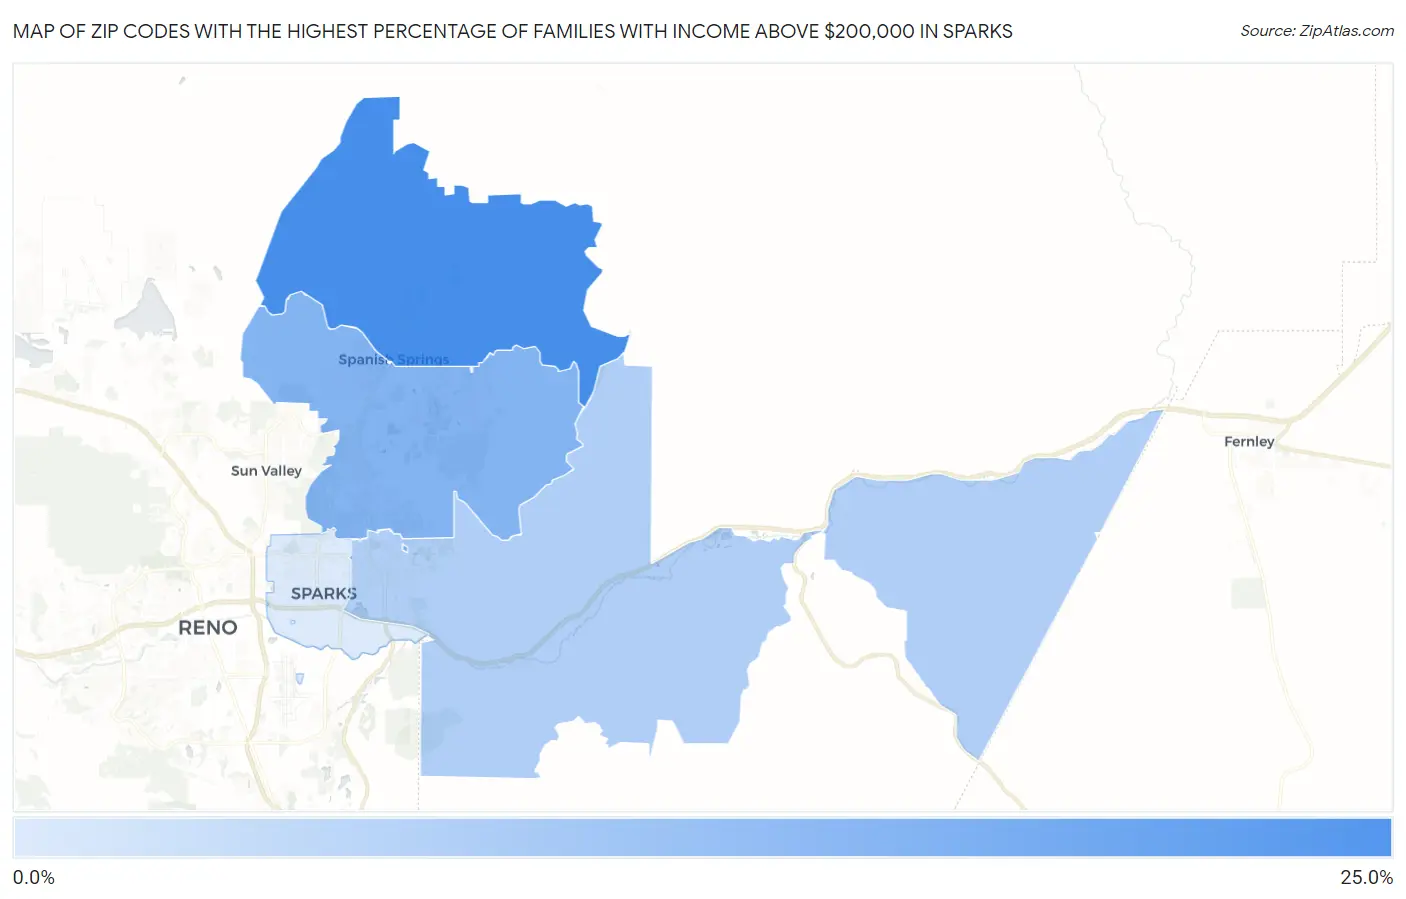
Map of Zip Codes with the Highest Percentage of Families with Income Above $200,000 in Sparks

0.0%
25.0%
Zip Codes with the Highest Percentage of Families with Income Above $200,000 in Sparks Map

Zip Codes with the Highest Percentage of Families with Income Above $200,000 in Sparks, NV

Zip Code Families with Income > $200k vs State vs National
1.8944124.6%10.9%(+13.7)#1514.8%(+9.80)#3,573
2.8943614.9%10.9%(+4.00)#3614.8%(+0.100)#7,027
3.894348.1%10.9%(-2.80)#7914.8%(-6.70)#13,051
4.894311.8%10.9%(-9.10)#12614.8%(-13.0)#24,779

Common Questions

What are the Top 3 Zip Codes with the Highest Percentage of Families with Income Above $200,000 in Sparks, NV?
Top 3 Zip Codes with the Highest Percentage of Families with Income Above $200,000 in Sparks, NV are:
#1
24.6%
#2
14.9%
#3
8.1%
What zip code has the Highest Percentage of Families with Income Above $200,000 in Sparks, NV?
89441 has the Highest Percentage of Families with Income Above $200,000 in Sparks, NV with 24.6%.
What is the Percentage of Families with Income Above $200,000 in Sparks, NV?
Percentage of Families with Income Above $200,000 in Sparks is 8.9%.
What is the Percentage of Families with Income Above $200,000 in Nevada?
Percentage of Families with Income Above $200,000 in Nevada is 10.9%.
What is the Percentage of Families with Income Above $200,000 in the United States?
Percentage of Families with Income Above $200,000 in the United States is 14.8%.