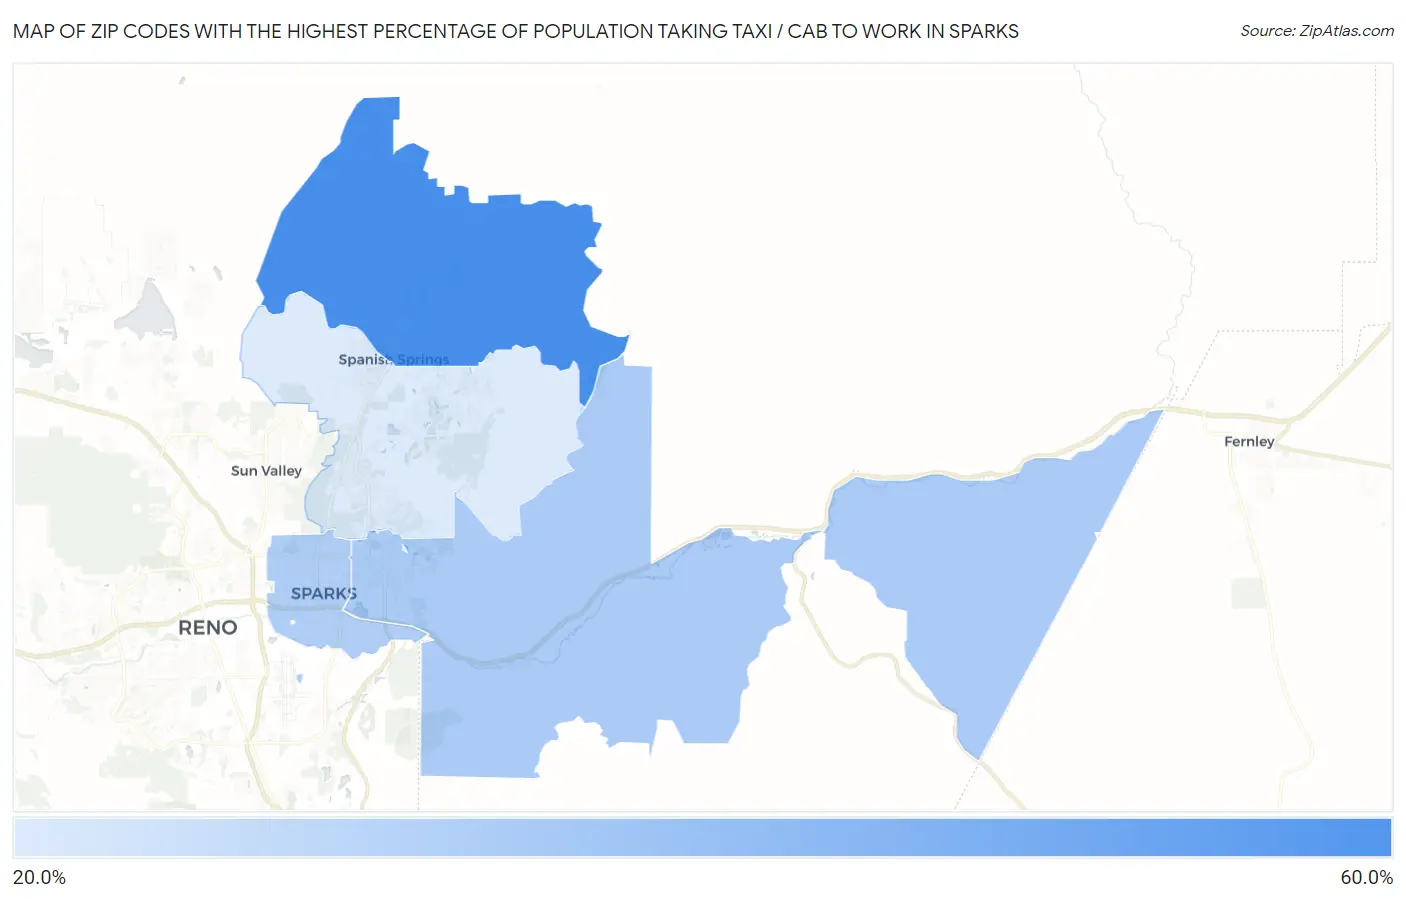
Zip Codes with the Highest Percentage of Population Taking Taxi / Cab to Work in Sparks, NV
RELATED REPORTS & OPTIONS
Taxi / Cab
Sparks
Compare Zip Codes
Map of Zip Codes with the Highest Percentage of Population Taking Taxi / Cab to Work in Sparks
25.5%
54.9%
Zip Codes with the Highest Percentage of Population Taking Taxi / Cab to Work in Sparks, NV
| Zip Code | % Take Taxi / Cab | vs State | vs National | |
| 1. | 89441 | 54.9% | 38.4%(+16.5)#9 | 38.2%(+16.7)#1,625 |
| 2. | 89434 | 34.8% | 38.4%(-3.60)#65 | 38.2%(-3.40)#8,976 |
| 3. | 89431 | 34.0% | 38.4%(-4.40)#69 | 38.2%(-4.20)#9,340 |
| 4. | 89436 | 25.5% | 38.4%(-12.9)#90 | 38.2%(-12.7)#12,141 |
1
Common Questions
What are the Top 3 Zip Codes with the Highest Percentage of Population Taking Taxi / Cab to Work in Sparks, NV?
Top 3 Zip Codes with the Highest Percentage of Population Taking Taxi / Cab to Work in Sparks, NV are:
What zip code has the Highest Percentage of Population Taking Taxi / Cab to Work in Sparks, NV?
89441 has the Highest Percentage of Population Taking Taxi / Cab to Work in Sparks, NV with 54.9%.
What is the Percentage of Population Taking Taxi / Cab to Work in Sparks, NV?
Percentage of Population Taking Taxi / Cab to Work in Sparks is 33.9%.
What is the Percentage of Population Taking Taxi / Cab to Work in Nevada?
Percentage of Population Taking Taxi / Cab to Work in Nevada is 38.4%.
What is the Percentage of Population Taking Taxi / Cab to Work in the United States?
Percentage of Population Taking Taxi / Cab to Work in the United States is 38.2%.