Zip Codes with the Highest Percentage of Population Employed in Health Diagnosing & Treating in Jefferson City, MO
RELATED REPORTS & OPTIONS
Health Diagnosing & Treating
Jefferson City
Compare Zip Codes
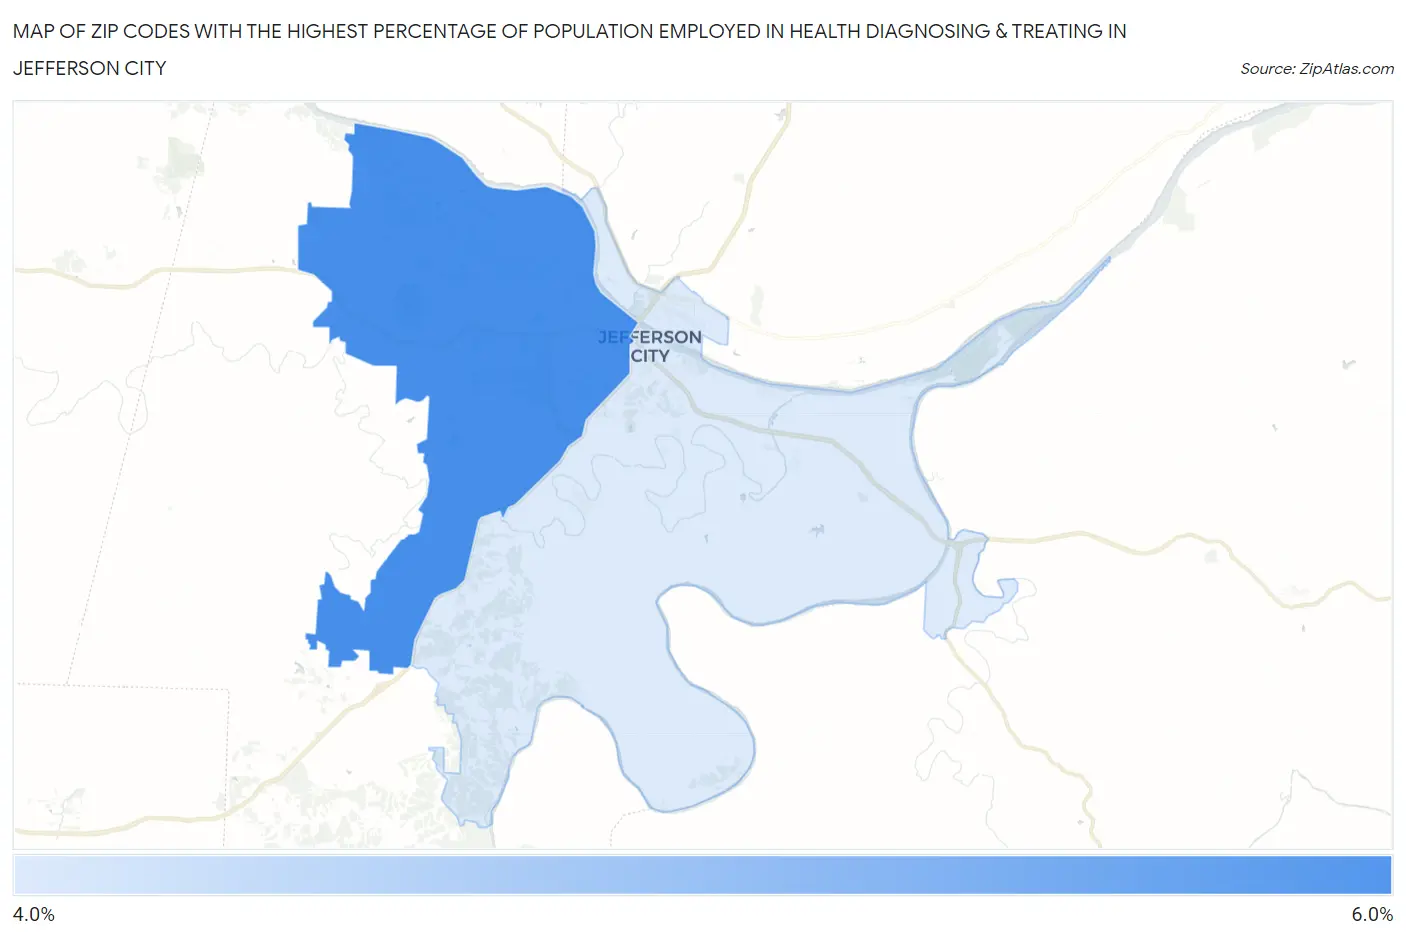
Map of Zip Codes with the Highest Percentage of Population Employed in Health Diagnosing & Treating in Jefferson City
4.4%
5.8%
Zip Codes with the Highest Percentage of Population Employed in Health Diagnosing & Treating in Jefferson City, MO
| Zip Code | % Employed | vs State | vs National | |
| 1. | 65109 | 5.8% | 6.9%(-1.15)#453 | 6.2%(-0.478)#14,736 |
| 2. | 65101 | 4.4% | 6.9%(-2.55)#600 | 6.2%(-1.88)#20,096 |
1
Common Questions
What are the Top Zip Codes with the Highest Percentage of Population Employed in Health Diagnosing & Treating in Jefferson City, MO?
Top Zip Codes with the Highest Percentage of Population Employed in Health Diagnosing & Treating in Jefferson City, MO are:
What zip code has the Highest Percentage of Population Employed in Health Diagnosing & Treating in Jefferson City, MO?
65109 has the Highest Percentage of Population Employed in Health Diagnosing & Treating in Jefferson City, MO with 5.8%.
What is the Percentage of Population Employed in Health Diagnosing & Treating in Jefferson City, MO?
Percentage of Population Employed in Health Diagnosing & Treating in Jefferson City is 5.1%.
What is the Percentage of Population Employed in Health Diagnosing & Treating in Missouri?
Percentage of Population Employed in Health Diagnosing & Treating in Missouri is 6.9%.
What is the Percentage of Population Employed in Health Diagnosing & Treating in the United States?
Percentage of Population Employed in Health Diagnosing & Treating in the United States is 6.2%.