Zip Codes with the Highest Percentage of Population Employed in Agriculture, Fishing & Hunting in Bethesda, MD
RELATED REPORTS & OPTIONS
Agriculture, Fishing & Hunting
Bethesda
Compare Zip Codes
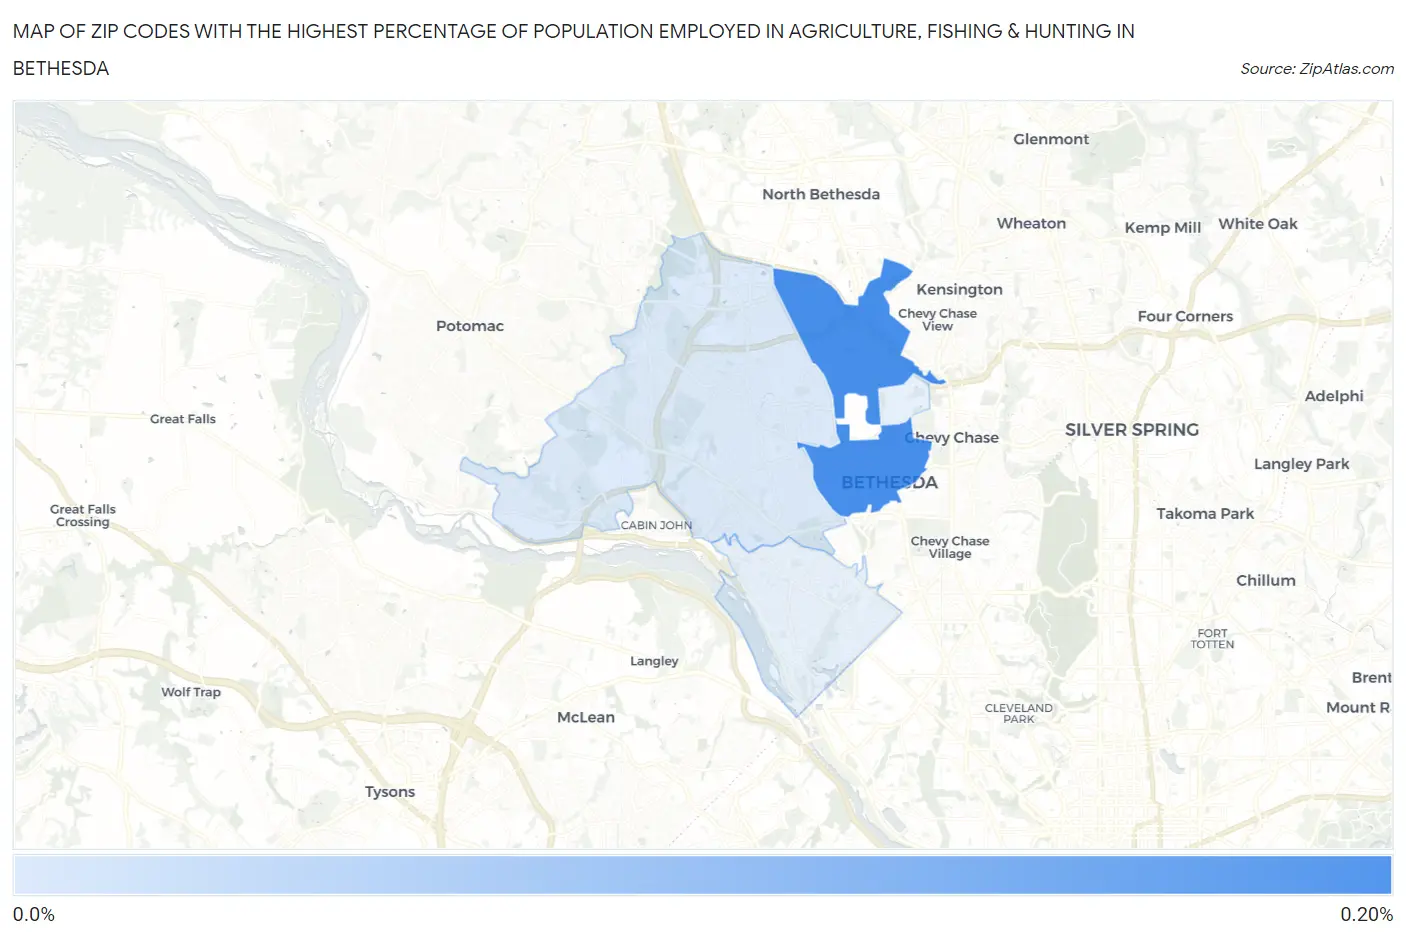
Map of Zip Codes with the Highest Percentage of Population Employed in Agriculture, Fishing & Hunting in Bethesda
0.047%
0.18%
Zip Codes with the Highest Percentage of Population Employed in Agriculture, Fishing & Hunting in Bethesda, MD
| Zip Code | % Employed | vs State | vs National | |
| 1. | 20814 | 0.18% | 0.50%(-0.323)#242 | 1.2%(-1.02)#22,580 |
| 2. | 20817 | 0.047% | 0.50%(-0.457)#290 | 1.2%(-1.15)#24,373 |
1
Common Questions
What are the Top 3 Zip Codes with the Highest Percentage of Population Employed in Agriculture, Fishing & Hunting in Bethesda, MD?
Top 3 Zip Codes with the Highest Percentage of Population Employed in Agriculture, Fishing & Hunting in Bethesda, MD are:
What zip code has the Highest Percentage of Population Employed in Agriculture, Fishing & Hunting in Bethesda, MD?
20814 has the Highest Percentage of Population Employed in Agriculture, Fishing & Hunting in Bethesda, MD with 0.18%.
What is the Percentage of Population Employed in Agriculture, Fishing & Hunting in Bethesda, MD?
Percentage of Population Employed in Agriculture, Fishing & Hunting in Bethesda is 0.067%.
What is the Percentage of Population Employed in Agriculture, Fishing & Hunting in Maryland?
Percentage of Population Employed in Agriculture, Fishing & Hunting in Maryland is 0.50%.
What is the Percentage of Population Employed in Agriculture, Fishing & Hunting in the United States?
Percentage of Population Employed in Agriculture, Fishing & Hunting in the United States is 1.2%.