Zip Codes with the Highest Percentage of Population Taking Taxi / Cab to Work in Lawrence, KS
RELATED REPORTS & OPTIONS
Taxi / Cab
Lawrence
Compare Zip Codes
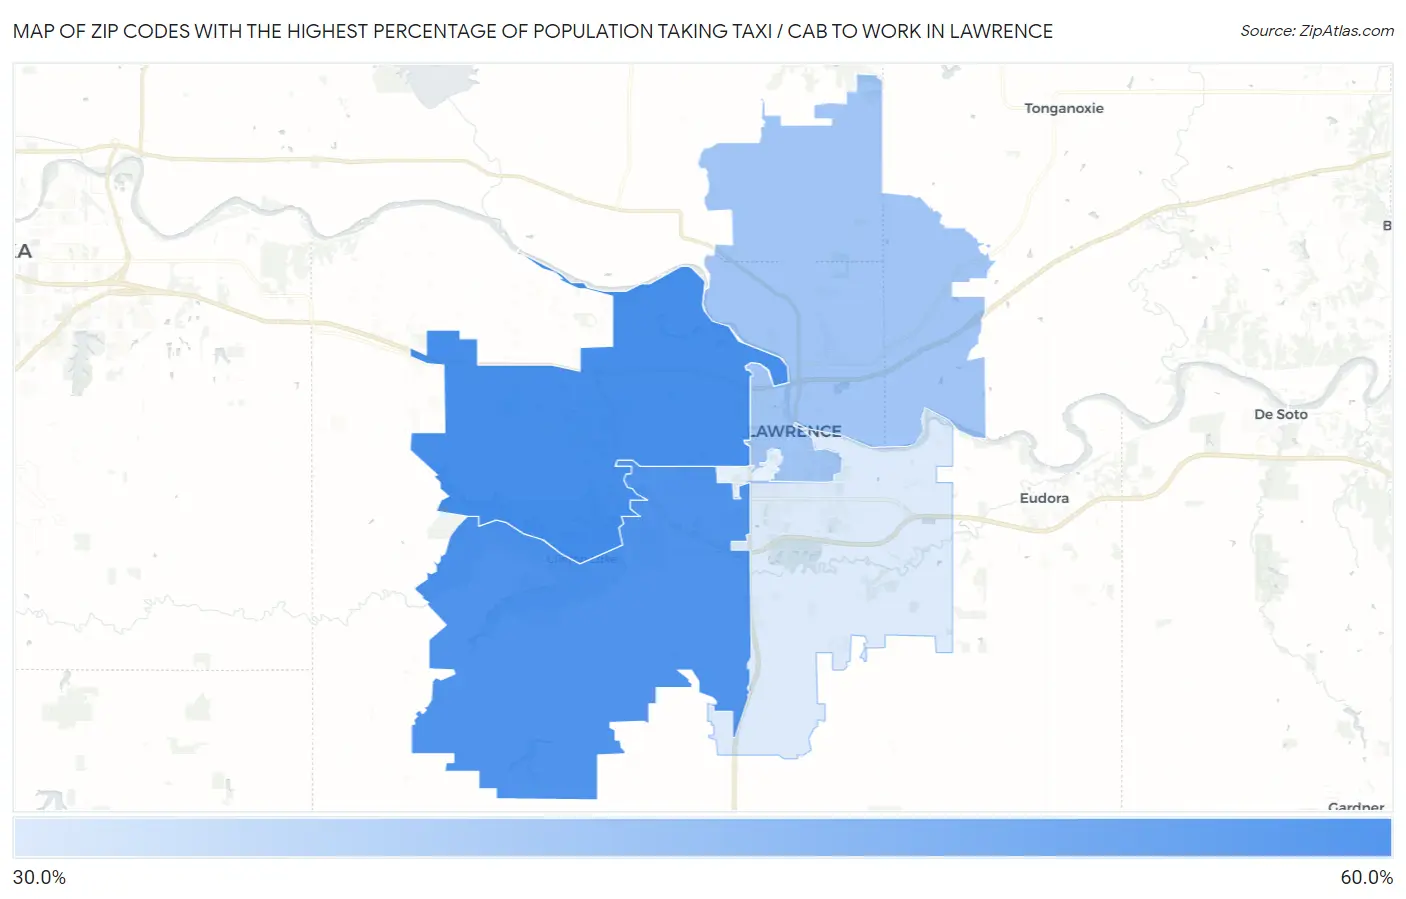
Map of Zip Codes with the Highest Percentage of Population Taking Taxi / Cab to Work in Lawrence
33.6%
50.2%
Zip Codes with the Highest Percentage of Population Taking Taxi / Cab to Work in Lawrence, KS
| Zip Code | % Take Taxi / Cab | vs State | vs National | |
| 1. | 66049 | 50.2% | 39.2%(+11.0)#51 | 38.2%(+12.0)#2,902 |
| 2. | 66047 | 49.1% | 39.2%(+9.90)#55 | 38.2%(+10.9)#3,247 |
| 3. | 66044 | 39.9% | 39.2%(+0.700)#94 | 38.2%(+1.70)#6,659 |
| 4. | 66046 | 33.6% | 39.2%(-5.60)#128 | 38.2%(-4.60)#9,536 |
1
Common Questions
What are the Top 3 Zip Codes with the Highest Percentage of Population Taking Taxi / Cab to Work in Lawrence, KS?
Top 3 Zip Codes with the Highest Percentage of Population Taking Taxi / Cab to Work in Lawrence, KS are:
What zip code has the Highest Percentage of Population Taking Taxi / Cab to Work in Lawrence, KS?
66049 has the Highest Percentage of Population Taking Taxi / Cab to Work in Lawrence, KS with 50.2%.
What is the Percentage of Population Taking Taxi / Cab to Work in Lawrence, KS?
Percentage of Population Taking Taxi / Cab to Work in Lawrence is 42.7%.
What is the Percentage of Population Taking Taxi / Cab to Work in Kansas?
Percentage of Population Taking Taxi / Cab to Work in Kansas is 39.2%.
What is the Percentage of Population Taking Taxi / Cab to Work in the United States?
Percentage of Population Taking Taxi / Cab to Work in the United States is 38.2%.