White/Caucasian vs Honduran Per Capita Income
COMPARE
White/Caucasian
Honduran
Per Capita Income
Per Capita Income Comparison
Whites/Caucasians
Hondurans
$42,180
PER CAPITA INCOME
15.9/ 100
METRIC RATING
205th/ 347
METRIC RANK
$37,031
PER CAPITA INCOME
0.1/ 100
METRIC RATING
304th/ 347
METRIC RANK
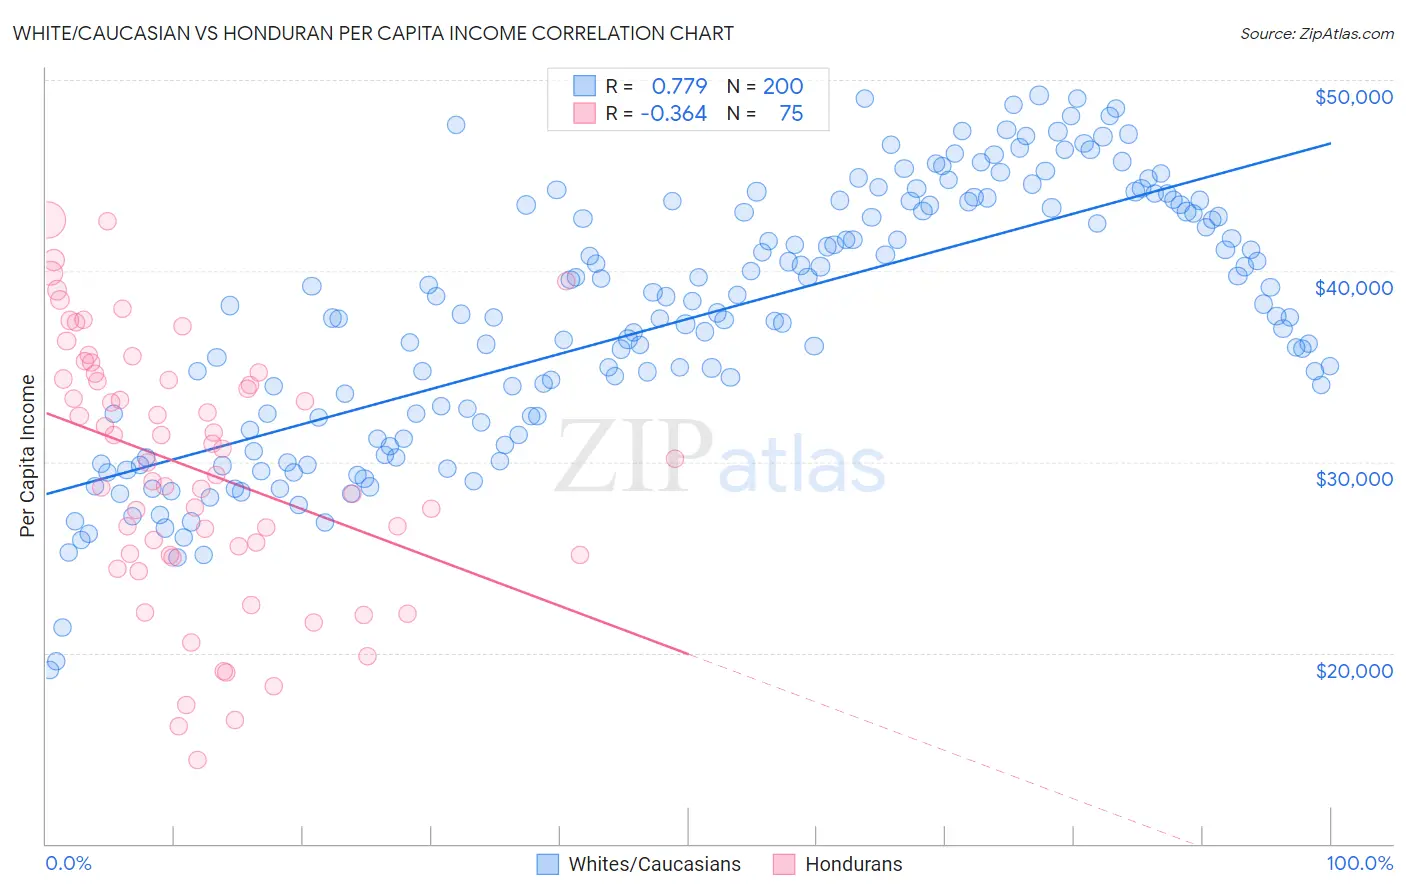
White/Caucasian vs Honduran Per Capita Income Correlation Chart
The statistical analysis conducted on geographies consisting of 585,276,990 people shows a strong positive correlation between the proportion of Whites/Caucasians and per capita income in the United States with a correlation coefficient (R) of 0.779 and weighted average of $42,180. Similarly, the statistical analysis conducted on geographies consisting of 357,835,074 people shows a mild negative correlation between the proportion of Hondurans and per capita income in the United States with a correlation coefficient (R) of -0.364 and weighted average of $37,031, a difference of 13.9%.
Per Capita Income Correlation Summary
| Measurement | White/Caucasian | Honduran |
| Minimum | $19,081 | $14,358 |
| Maximum | $49,196 | $42,674 |
| Range | $30,115 | $28,316 |
| Mean | $37,504 | $29,671 |
| Median | $37,771 | $30,191 |
| Interquartile 25% (IQ1) | $31,862 | $25,099 |
| Interquartile 75% (IQ3) | $43,459 | $34,632 |
| Interquartile Range (IQR) | $11,597 | $9,533 |
| Standard Deviation (Sample) | $6,823 | $6,736 |
| Standard Deviation (Population) | $6,806 | $6,690 |
Similar Demographics by Per Capita Income
Demographics Similar to Whites/Caucasians by Per Capita Income
In terms of per capita income, the demographic groups most similar to Whites/Caucasians are Ghanaian ($42,164, a difference of 0.040%), Aleut ($42,210, a difference of 0.070%), Spanish ($42,249, a difference of 0.16%), Immigrants from Bosnia and Herzegovina ($42,278, a difference of 0.23%), and Venezuelan ($42,074, a difference of 0.25%).
| Demographics | Rating | Rank | Per Capita Income |
| Immigrants | Portugal | 19.7 /100 | #198 | Poor $42,412 |
| Barbadians | 19.6 /100 | #199 | Poor $42,406 |
| Vietnamese | 19.0 /100 | #200 | Poor $42,368 |
| Immigrants | Thailand | 17.6 /100 | #201 | Poor $42,289 |
| Immigrants | Bosnia and Herzegovina | 17.5 /100 | #202 | Poor $42,278 |
| Spanish | 17.0 /100 | #203 | Poor $42,249 |
| Aleuts | 16.4 /100 | #204 | Poor $42,210 |
| Whites/Caucasians | 15.9 /100 | #205 | Poor $42,180 |
| Ghanaians | 15.7 /100 | #206 | Poor $42,164 |
| Venezuelans | 14.4 /100 | #207 | Poor $42,074 |
| Panamanians | 13.9 /100 | #208 | Poor $42,035 |
| Immigrants | Sudan | 13.2 /100 | #209 | Poor $41,986 |
| Ecuadorians | 12.9 /100 | #210 | Poor $41,958 |
| Immigrants | Panama | 11.6 /100 | #211 | Poor $41,853 |
| Immigrants | Senegal | 11.3 /100 | #212 | Poor $41,830 |
Demographics Similar to Hondurans by Per Capita Income
In terms of per capita income, the demographic groups most similar to Hondurans are Inupiat ($36,999, a difference of 0.080%), Paiute ($37,066, a difference of 0.090%), Shoshone ($37,072, a difference of 0.11%), Ottawa ($37,101, a difference of 0.19%), and Immigrants from Bahamas ($37,193, a difference of 0.44%).
| Demographics | Rating | Rank | Per Capita Income |
| Haitians | 0.1 /100 | #297 | Tragic $37,289 |
| Immigrants | Caribbean | 0.1 /100 | #298 | Tragic $37,254 |
| Cherokee | 0.1 /100 | #299 | Tragic $37,203 |
| Immigrants | Bahamas | 0.1 /100 | #300 | Tragic $37,193 |
| Ottawa | 0.1 /100 | #301 | Tragic $37,101 |
| Shoshone | 0.1 /100 | #302 | Tragic $37,072 |
| Paiute | 0.1 /100 | #303 | Tragic $37,066 |
| Hondurans | 0.1 /100 | #304 | Tragic $37,031 |
| Inupiat | 0.1 /100 | #305 | Tragic $36,999 |
| Immigrants | Haiti | 0.0 /100 | #306 | Tragic $36,849 |
| Immigrants | Latin America | 0.0 /100 | #307 | Tragic $36,823 |
| Fijians | 0.0 /100 | #308 | Tragic $36,690 |
| Immigrants | Honduras | 0.0 /100 | #309 | Tragic $36,665 |
| Ute | 0.0 /100 | #310 | Tragic $36,651 |
| Chippewa | 0.0 /100 | #311 | Tragic $36,631 |