White/Caucasian vs Serbian Per Capita Income
COMPARE
White/Caucasian
Serbian
Per Capita Income
Per Capita Income Comparison
Whites/Caucasians
Serbians
$42,180
PER CAPITA INCOME
15.9/ 100
METRIC RATING
205th/ 347
METRIC RANK
$46,551
PER CAPITA INCOME
96.2/ 100
METRIC RATING
107th/ 347
METRIC RANK
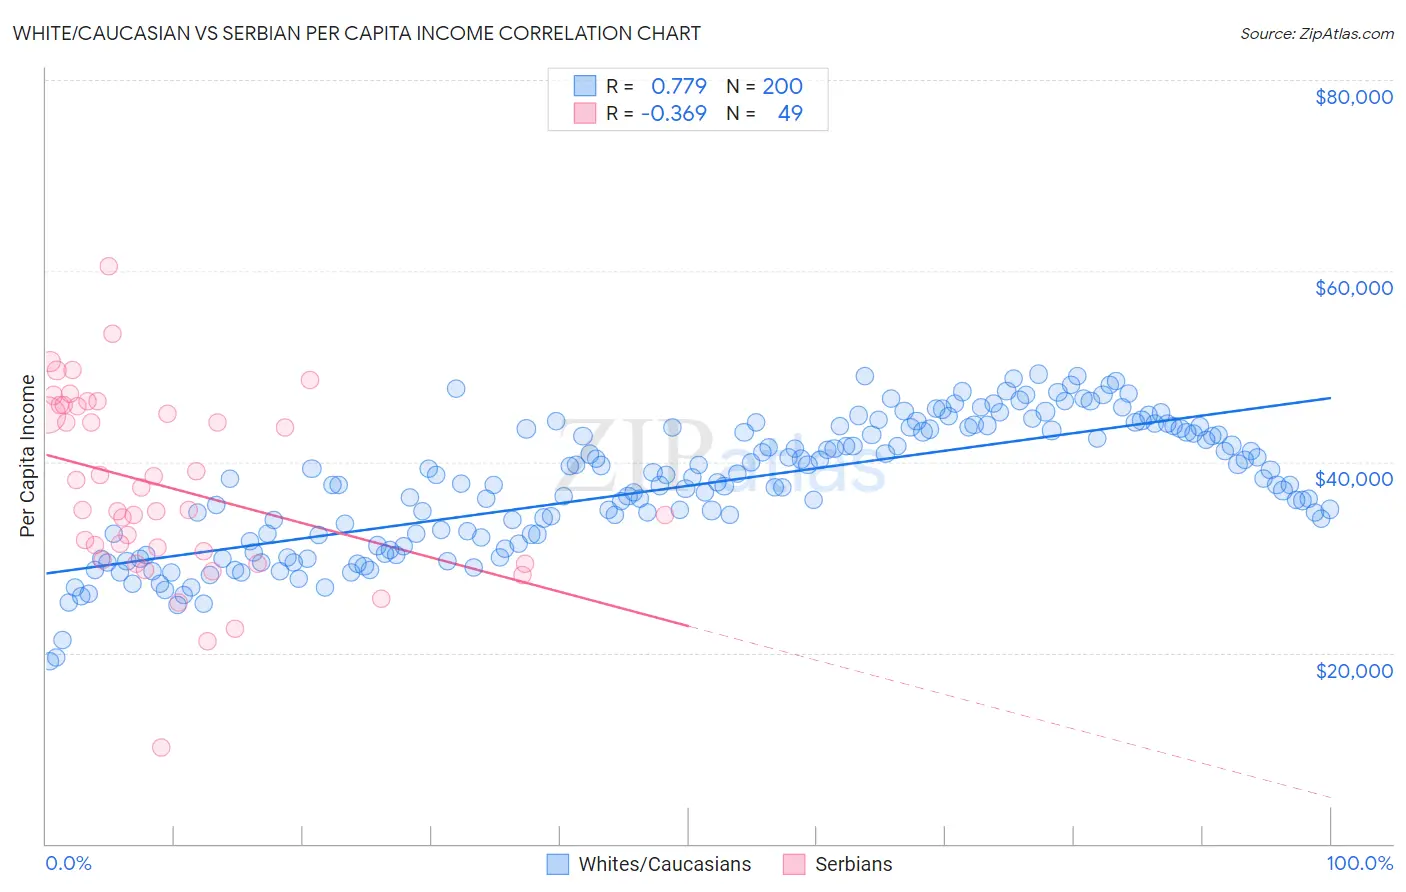
White/Caucasian vs Serbian Per Capita Income Correlation Chart
The statistical analysis conducted on geographies consisting of 585,276,990 people shows a strong positive correlation between the proportion of Whites/Caucasians and per capita income in the United States with a correlation coefficient (R) of 0.779 and weighted average of $42,180. Similarly, the statistical analysis conducted on geographies consisting of 267,655,306 people shows a mild negative correlation between the proportion of Serbians and per capita income in the United States with a correlation coefficient (R) of -0.369 and weighted average of $46,551, a difference of 10.4%.
Per Capita Income Correlation Summary
| Measurement | White/Caucasian | Serbian |
| Minimum | $19,081 | $10,108 |
| Maximum | $49,196 | $60,445 |
| Range | $30,115 | $50,337 |
| Mean | $37,504 | $37,423 |
| Median | $37,771 | $35,016 |
| Interquartile 25% (IQ1) | $31,862 | $30,161 |
| Interquartile 75% (IQ3) | $43,459 | $45,911 |
| Interquartile Range (IQR) | $11,597 | $15,749 |
| Standard Deviation (Sample) | $6,823 | $9,694 |
| Standard Deviation (Population) | $6,806 | $9,595 |
Similar Demographics by Per Capita Income
Demographics Similar to Whites/Caucasians by Per Capita Income
In terms of per capita income, the demographic groups most similar to Whites/Caucasians are Ghanaian ($42,164, a difference of 0.040%), Aleut ($42,210, a difference of 0.070%), Spanish ($42,249, a difference of 0.16%), Immigrants from Bosnia and Herzegovina ($42,278, a difference of 0.23%), and Venezuelan ($42,074, a difference of 0.25%).
| Demographics | Rating | Rank | Per Capita Income |
| Immigrants | Portugal | 19.7 /100 | #198 | Poor $42,412 |
| Barbadians | 19.6 /100 | #199 | Poor $42,406 |
| Vietnamese | 19.0 /100 | #200 | Poor $42,368 |
| Immigrants | Thailand | 17.6 /100 | #201 | Poor $42,289 |
| Immigrants | Bosnia and Herzegovina | 17.5 /100 | #202 | Poor $42,278 |
| Spanish | 17.0 /100 | #203 | Poor $42,249 |
| Aleuts | 16.4 /100 | #204 | Poor $42,210 |
| Whites/Caucasians | 15.9 /100 | #205 | Poor $42,180 |
| Ghanaians | 15.7 /100 | #206 | Poor $42,164 |
| Venezuelans | 14.4 /100 | #207 | Poor $42,074 |
| Panamanians | 13.9 /100 | #208 | Poor $42,035 |
| Immigrants | Sudan | 13.2 /100 | #209 | Poor $41,986 |
| Ecuadorians | 12.9 /100 | #210 | Poor $41,958 |
| Immigrants | Panama | 11.6 /100 | #211 | Poor $41,853 |
| Immigrants | Senegal | 11.3 /100 | #212 | Poor $41,830 |
Demographics Similar to Serbians by Per Capita Income
In terms of per capita income, the demographic groups most similar to Serbians are Immigrants from Kuwait ($46,543, a difference of 0.020%), British ($46,571, a difference of 0.040%), Ethiopian ($46,569, a difference of 0.040%), Immigrants from Northern Africa ($46,531, a difference of 0.040%), and Chilean ($46,459, a difference of 0.20%).
| Demographics | Rating | Rank | Per Capita Income |
| Immigrants | Lebanon | 97.5 /100 | #100 | Exceptional $46,938 |
| Immigrants | Uzbekistan | 97.5 /100 | #101 | Exceptional $46,929 |
| Immigrants | Western Asia | 97.4 /100 | #102 | Exceptional $46,876 |
| Syrians | 97.2 /100 | #103 | Exceptional $46,837 |
| Brazilians | 96.8 /100 | #104 | Exceptional $46,700 |
| British | 96.3 /100 | #105 | Exceptional $46,571 |
| Ethiopians | 96.3 /100 | #106 | Exceptional $46,569 |
| Serbians | 96.2 /100 | #107 | Exceptional $46,551 |
| Immigrants | Kuwait | 96.2 /100 | #108 | Exceptional $46,543 |
| Immigrants | Northern Africa | 96.2 /100 | #109 | Exceptional $46,531 |
| Chileans | 95.9 /100 | #110 | Exceptional $46,459 |
| Taiwanese | 95.8 /100 | #111 | Exceptional $46,455 |
| Immigrants | Morocco | 95.7 /100 | #112 | Exceptional $46,430 |
| Immigrants | Albania | 95.5 /100 | #113 | Exceptional $46,387 |
| Afghans | 94.9 /100 | #114 | Exceptional $46,268 |